


.svg)


New
Acceldata Launches Autonomous Data & AI Platform for Agentic AI Era. Learn More →
Platform Overview

Data & AI Observability
Agentic Data Engineering
Data Warehousing
Agentic Runtime
Agentic Data Management
Hadoop Modernization
Platform Overview
Everything you need to build, govern, and scale data and AI workloads—one unified platform.
xLake Architecture
Manage your data estate under one platform
Explore Integrations


Data & AI Observability
Monitor, detect, and resolve data and AI issues with end-to-end observability across pipelines.
Explore
Agentic Data Engineering
Build, orchestrate, and run data pipelines with intelligent agents that automate the entire engineering workflow.
Explore ADE
Data Warehousing
Query your lakehouse in-place with Velox-accelerated performance. 10x faster than traditional warehouses.
Explore Data Warehousing
CAPABILITIES


Agentic Runtime
Distributed training, high-throughput inference, and GPU notebooks—everything you need for production AI.
Explore
CAPABILITIES


Agentic Data Management
Build, deploy, and manage intelligent agents to automate and optimize data operations.
Explore ADM

Industries
Browse solutions to help you solve the complex business challenges unique to your industry.
Explore Case Studies
Resources
Browse materials to help you access the tools, guides, and insights essential to your workflows.


Company
Learn about our mission, leadership, and vision driving modern data operations forward.


Products

Industry
Resources
Company

Back
Platform Overview
Data & AI Observability
Agentic Data Management
Agentic Data Engineering
Data Warehousing
Data Science
Data Platform Modernization
Back
Industries
Browse solutions to help you solve the complex business challenges unique to your industry.
Explore Case Studies
Back
Resources
Browse materials to help you access the tools, guides, and insights essential to your workflows.
Back
Company
Learn about our mission, leadership, and vision driving modern data operations forward.
Back
Platform Overview
Everything you need to build, govern, and scale data and AI workloads—one unified platform.
xLake Architecture
Manage your data estate under one platform
Explore Integrations
Back
Data & AI Observability
Monitor, detect, and resolve data and AI issues with end-to-end observability across pipelines.
Explore
Back
Agentic Data Management
Build, deploy, and manage intelligent agents to automate and optimize data operations.
Explore ADM
Back
Agentic Data Engineering
Build, orchestrate, and run data pipelines with intelligent agents that automate the entire engineering workflow.
Explore ADE
Back
Data Warehousing
Query your lakehouse in-place with Velox-accelerated performance. 10x faster than traditional warehouses.
Explore Data Warehousing
CAPABILITIES
Back
Agentic Runtime
Distributed training, high-throughput inference, and GPU notebooks—everything you need for production AI.
Explore
CAPABILITIES
Products
Platform Overview
Data & AI Observability
Agentic Data Management
Agentic Data Engineering
Data Warehousing
ML & AI Applications
Business Applications
Data Platform Modernization
Platform Overview
Lorem ipsum dolor sit amet, consectetur adipiscing elit. Suspendisse sollicitudin mi
Explore Platform
Data & AI Observability
Monitor, detect, and resolve data issues with end-to-end observability across pipelines.
Explore ADOC
Agentic Data Management
Monitor, detect, and resolve data issues with end-to-end observability across pipelines.
Explore ADM
Agentic Data Engineering
Lorem ipsum dolor sit amet, consectetur adipiscing elit. Suspendisse sollicitudin mi nibh
Explore ADE
Data Warehousing
AI-powered observability and optimization for Hadoop and big data environments.
Explore Data Warehousing


ML & AI Applications
Lorem ipsum dolor sit amet, consectetur adipiscing elit. Suspendisse sollicitudin
Explore ML & AI Applications


Data & AI Observability
Lorem ipsum dolor sit amet, consectetur adipiscing elit. Suspendisse so
Explore Business Applications
Open Data Platform
An open-source data platform for Hadoop modernization, flexibility, and long-term control.
Explore ODP
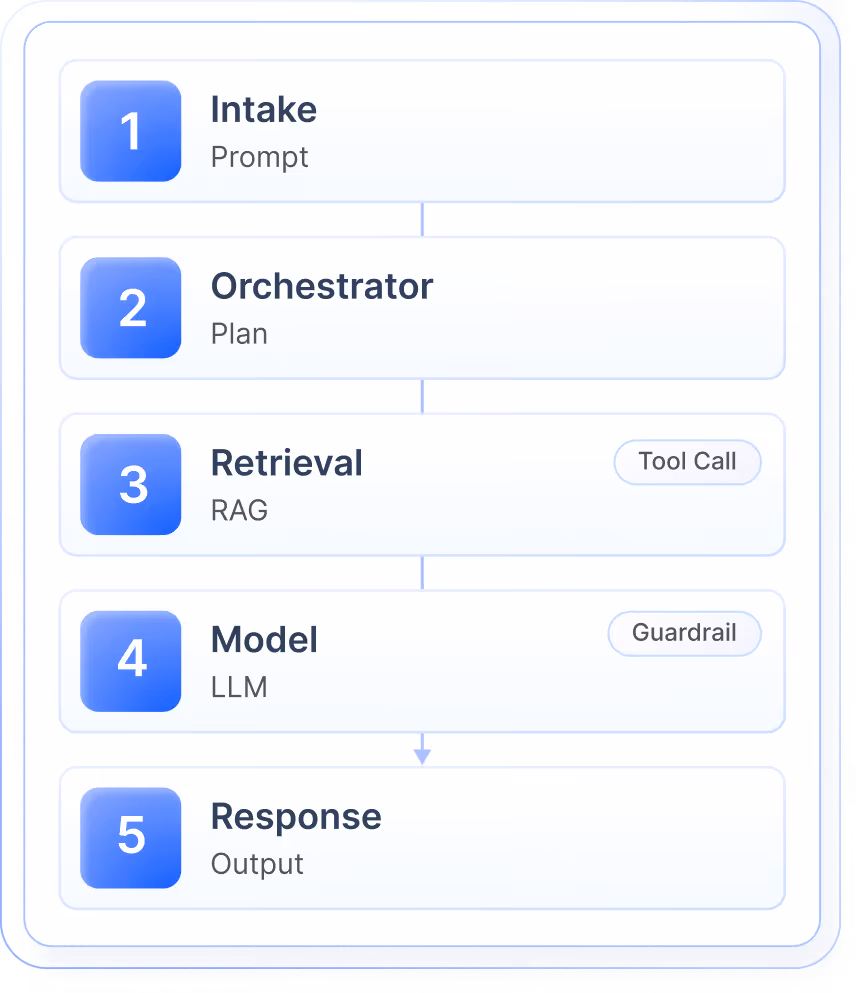
Every execution.
Every step.
Every signal.
Every prompt, model call, retrieval step, and tool invocation — captured, connected, and searchable.
Debug the exact request that broke.

TRUSTED BY ENTERPRISE DATA TEAMS WORLDWIDE


Full visibility into every execution.
Six signal layers. One connected trace. No gaps.

End-to-end execution tracing
Capture the full path of every request — from intake through orchestration, retrieval, model inference, tool calls, guardrail checks, and final response — as a single connected trace.

Tool call monitoring
Log every tool invocation with name, arguments, response, status, latency, and retry behavior. Surface tool misuse and dependency failures before they reach users.

Step-by-step run debugging
Inspect any run as a step-by-step timeline. See inputs and outputs at each step instead of inferring what went wrong from aggregate dashboards.

Cross-version comparison
Compare traces across models, prompts, and versions. Validate that a change did what you intended — and didn't quietly break something else.

Token, cost, latency & error tracking
Every trace carries token usage, cost attribution, latency breakdown, and error context. Catch usage trends before they become budget conversations.

Centralized search
Search across every captured signal in one place. Move from a flagged alert directly into the relevant trace and supporting evidence in one workflow.
How it works
From instrumentation to fix in four steps

Instrument
Add lightweight SDK instrumentation or use a native framework integration. No infrastructure changes required.
pip install acceldata-sdk

Capture
Every request automatically generates a complete trace — prompts, model calls, retrieval steps, tool invocations, and outputs.
req
trace
span
log

Visualize
Traces appear as connected execution timelines with filters for project, model, prompt version, environment, and status.


Debug
Drill into any failed run, inspect each step, compare against successful runs, and ship the fix.
.svg)
Error: timeout at step 3
.avif)
No proprietary format. No lock-in.
Acceldata ingests traces over OpenTelemetry and OTLP — the same telemetry pipeline you already use.
OpenTelemetry and OTLP
Native OTEL ingestion — same pipeline you use today. No new agents, no new agents.
Native OTEL ingestion — same pipeline you use today. No new agents, no new agents.
Framework integrations out of the box
LangChain, LangGraph, LlamaIndex, OpenAI, Anthropic, CrewAI, AutoGen, ADK — native or SDK.
LangChain, LangGraph, LlamaIndex, OpenAI, Anthropic, CrewAI, AutoGen, ADK — native or SDK.
Cross-platform ingestion
OTLP ingestion across cloud, on-prem, and hybrid environments — no per-platform rewrites.
OTLP ingestion across cloud, on-prem, and hybrid environments — no per-platform rewrites.
Built different. For production AI.
Not a dev tool retrofitted for scale. Designed from the ground up for agentic complexity at production volume.

Trace fidelity built for agentic complexity
Acceldata captures the parent-child structure of agentic execution — orchestrators, sub-agents, tool calls, retrieval steps — without flattening it into a single span.

Production-grade from day one
Built for real production volume, not dev-environment debugging. Token, cost, latency, and error context are first-class on every trace.

Open by default
OpenTelemetry-native means no instrumentation lock-in. Your traces stay portable and feed downstream tools when you need them to.

Dominate with Data
40%
reduction in pipeline
downtime
downtime

30%
faster time-to-model
deployment
deployment
25%
lower cluster costs
99.9%
SLA adherence on
migrated workloads
migrated workloads
Ready to get started
Explore all the ways to experience Acceldata for yourself.
