Modern Hadoop Starts Here
Acceldata helps you modernize, optimize, and future-proof your Hadoop environment—flexibly, efficiently, and without compromise.


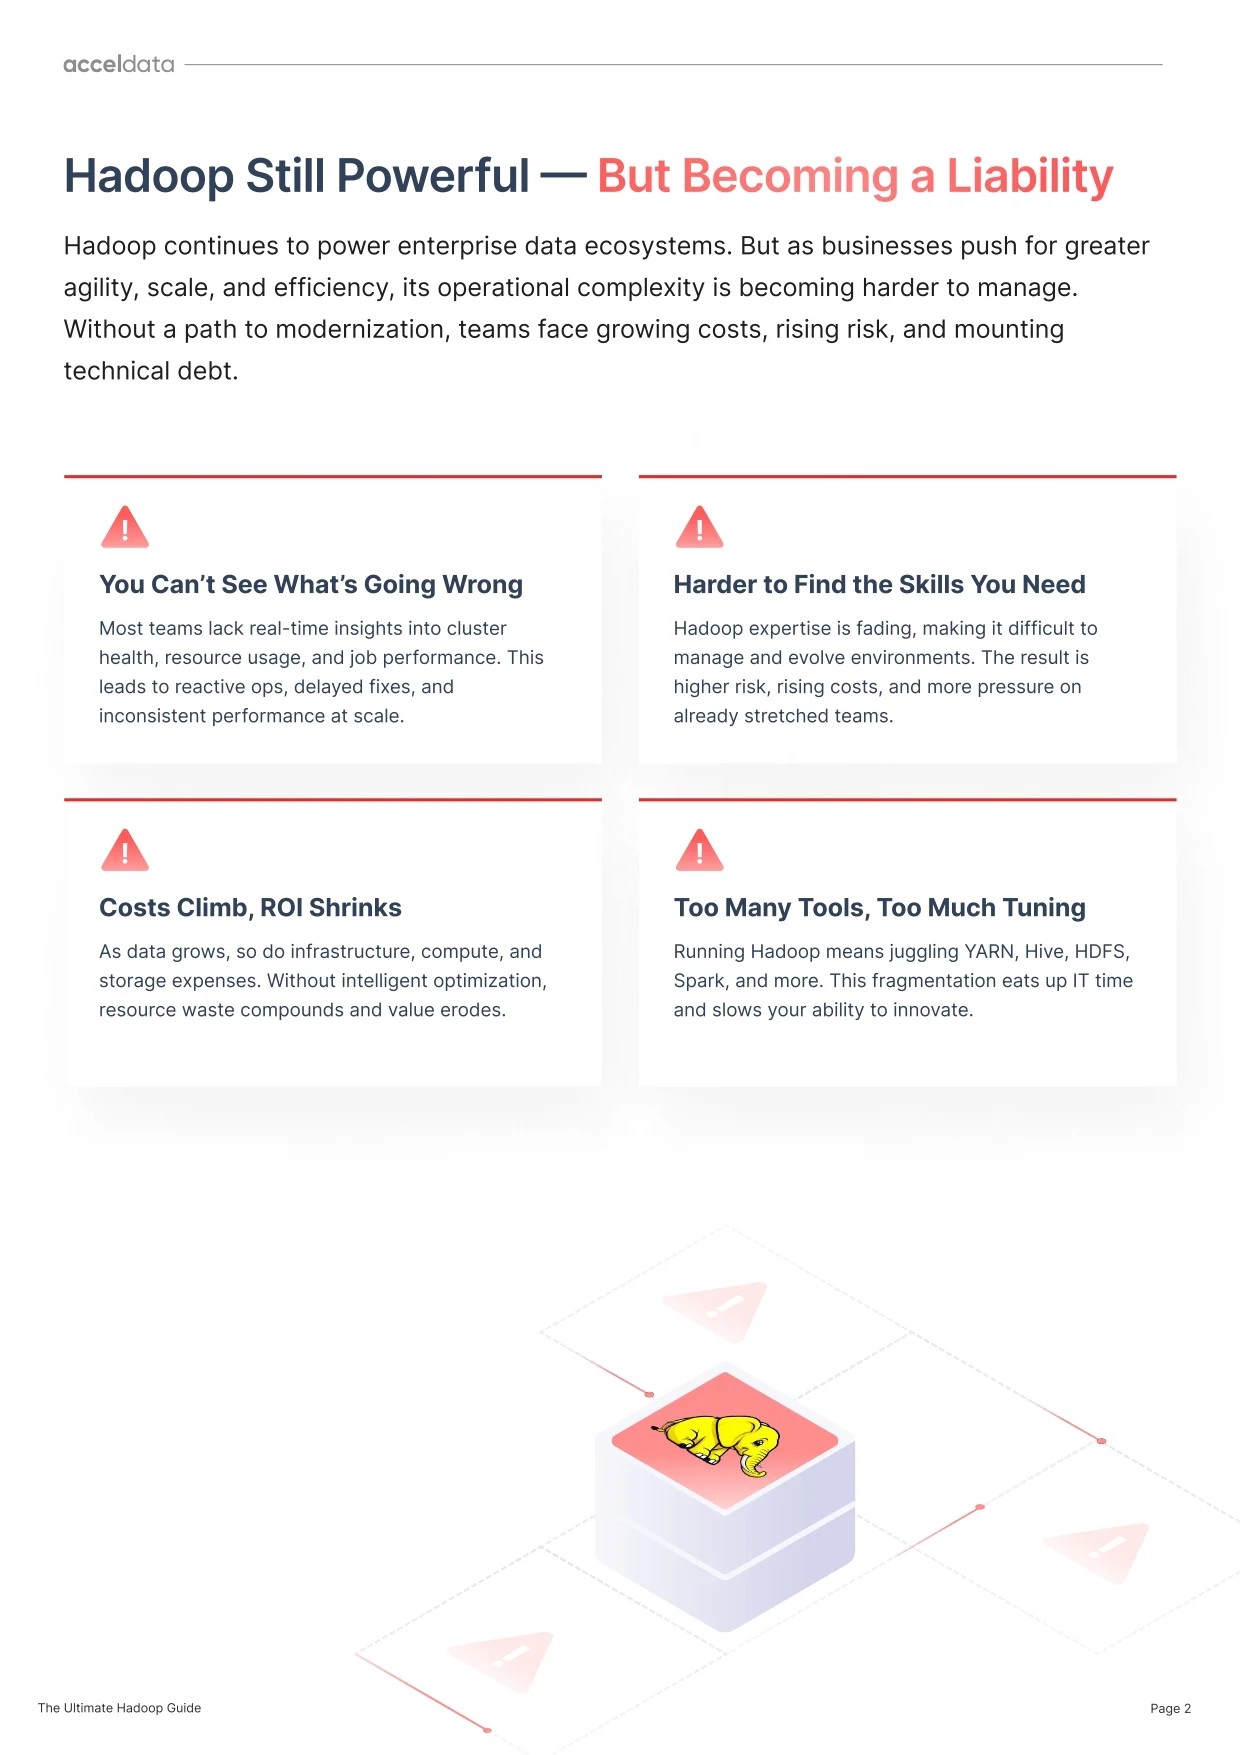
Hadoop Still Powerful — But Becoming a Liability
Hadoop remains essential—but its cost, complexity, and skills gap make it harder to scale and sustain.

Limited Visibility & Control

Shrinking Talent, Rising Risk

Rising Costs, Lower ROI

Fragmented Stack, High Overhead
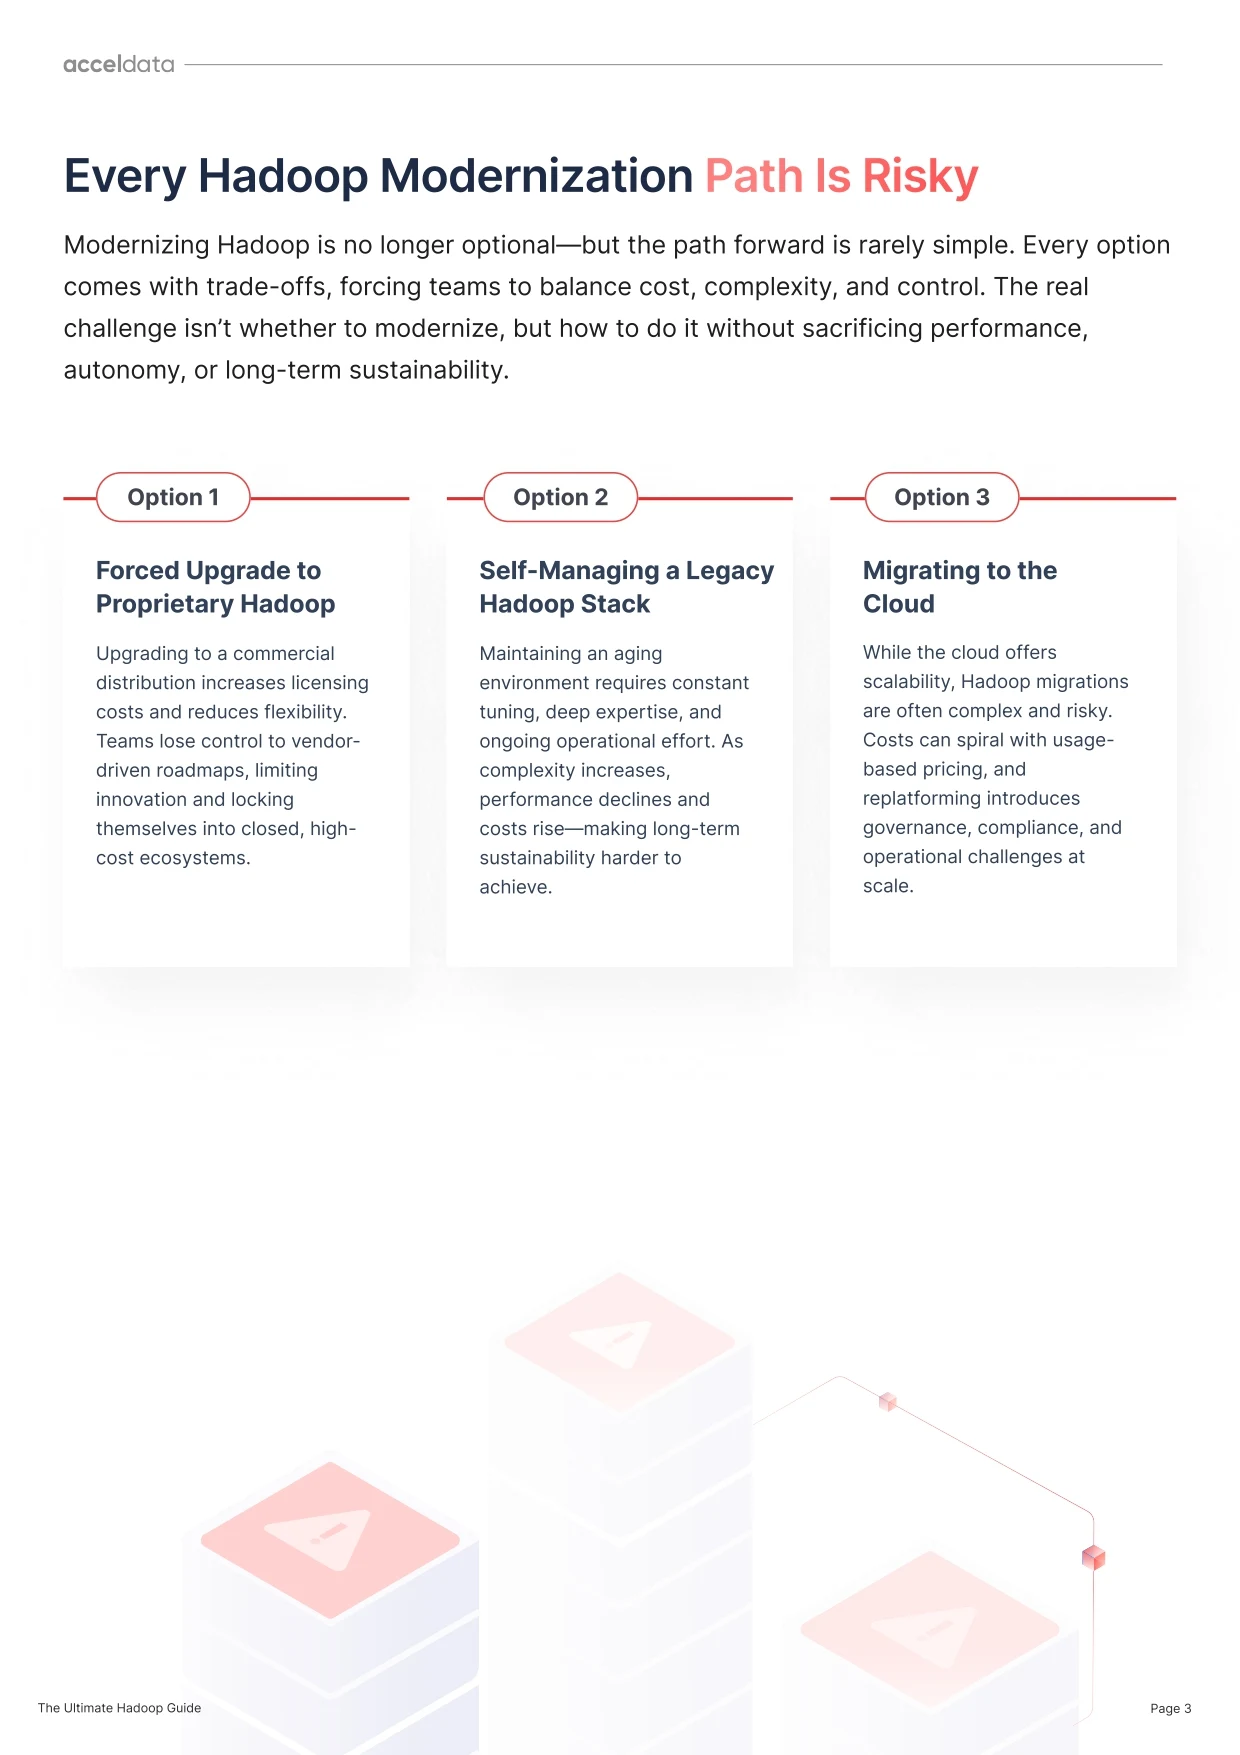
Every Hadoop Modernization Path Is Risky
Modernizing Hadoop is essential—but every path comes with trade-offs. Teams must balance cost, complexity, and control without giving up performance or long-term flexibility.
Forced Upgrade to Proprietary Hadoop
Higher costs, reduced flexibility, and vendor lock-in with little room to innovate.
Self-Managing a Legacy Hadoop Stack
Constant tuning and deep expertise required—complexity grows, sustainability drops.
Migrating to the Cloud
Promises scalability, but brings risk: high costs, replatforming effort, and compliance challenges.
Fixing Hadoop Without Compromise
Acceldata solves Hadoop’s toughest challenges with open, scalable, and intelligent solutions— giving you a clear, flexible path forward.
Forced Upgrade to Proprietary Hadoop
Self-Managing Hadoop & Cluster Optimization
Migrating to the Cloud


Upgrade without lock-in. Retain flexibility and maximize existing infrastructure with a modular, open-source platform.


Gain real-time visibility, improve reliability, and reduce operational overhead.


Migrate with confidence using cost insights and workload analytics—fast, low-risk, and ROI-driven.
Ultimate Hadoop Guide
Explore modernization strategies, migration paths, and real-world success stories—all in one actionable resource.


Why Acceldata Is Your Best Choice
Acceldata helps you modernize Hadoop with flexibility, efficiency, and intelligence— on your terms, at your pace, and built to scale.
Modernize Hadoop
Optimize Resources
Seamless Transitions
Flexible & Scalable
Complete Observability
AI-Driven Innovation
Choose Your Hadoop Path Forward
Purpose-built for enterprise-scale Hadoop—flexible, intelligent, and ready for what’s next.
Open Data Platform (ODP)
Modernize your Hadoop stack with an open, modular architecture built for hybrid and cloud-ready deployments.

Pulse
Gain deep visibility, optimize performance, and automate issue resolution with AI-powered observability.

Latest Hadoop Resources
Is Hadoop Still Worth It?
Find out in our on-demand webinar—covering its origins, ongoing value, and how to modernize without starting over.


Ready to Modernize Hadoop?
Get expert guidance on the best path forward—no pressure, just answers.


.webp)
.webp)

