


.svg)


New
Acceldata Launches Autonomous Data & AI Platform for Agentic AI Era. Learn More →
Platform Overview

Data & AI Observability
Agentic Data Engineering
Data Warehousing
Agentic Runtime
Agentic Data Management
Hadoop Modernization
Platform Overview
Everything you need to build, govern, and scale data and AI workloads—one unified platform.
xLake Architecture
Manage your data estate under one platform
Explore Integrations


Data & AI Observability
Monitor, detect, and resolve data and AI issues with end-to-end observability across pipelines.
Explore
Agentic Data Engineering
Build, orchestrate, and run data pipelines with intelligent agents that automate the entire engineering workflow.
Explore ADE
Data Warehousing
Query your lakehouse in-place with Velox-accelerated performance. 10x faster than traditional warehouses.
Explore Data Warehousing
CAPABILITIES


Agentic Runtime
Distributed training, high-throughput inference, and GPU notebooks—everything you need for production AI.
Explore
CAPABILITIES


Agentic Data Management
Build, deploy, and manage intelligent agents to automate and optimize data operations.
Explore ADM

Industries
Browse solutions to help you solve the complex business challenges unique to your industry.
Explore Case Studies
Resources
Browse materials to help you access the tools, guides, and insights essential to your workflows.


Company
Learn about our mission, leadership, and vision driving modern data operations forward.


Products

Industry
Resources
Company

Back
Platform Overview
Data & AI Observability
Agentic Data Management
Agentic Data Engineering
Data Warehousing
Data Science
Data Platform Modernization
Back
Industries
Browse solutions to help you solve the complex business challenges unique to your industry.
Explore Case Studies
Back
Resources
Browse materials to help you access the tools, guides, and insights essential to your workflows.
Back
Company
Learn about our mission, leadership, and vision driving modern data operations forward.
Back
Platform Overview
Everything you need to build, govern, and scale data and AI workloads—one unified platform.
xLake Architecture
Manage your data estate under one platform
Explore Integrations
Back
Data & AI Observability
Monitor, detect, and resolve data and AI issues with end-to-end observability across pipelines.
Explore
Back
Agentic Data Management
Build, deploy, and manage intelligent agents to automate and optimize data operations.
Explore ADM
Back
Agentic Data Engineering
Build, orchestrate, and run data pipelines with intelligent agents that automate the entire engineering workflow.
Explore ADE
Back
Data Warehousing
Query your lakehouse in-place with Velox-accelerated performance. 10x faster than traditional warehouses.
Explore Data Warehousing
CAPABILITIES
Back
Agentic Runtime
Distributed training, high-throughput inference, and GPU notebooks—everything you need for production AI.
Explore
CAPABILITIES
Products
Platform Overview
Data & AI Observability
Agentic Data Management
Agentic Data Engineering
Data Warehousing
ML & AI Applications
Business Applications
Data Platform Modernization
Platform Overview
Lorem ipsum dolor sit amet, consectetur adipiscing elit. Suspendisse sollicitudin mi
Explore Platform
Data & AI Observability
Monitor, detect, and resolve data issues with end-to-end observability across pipelines.
Explore ADOC
Agentic Data Management
Monitor, detect, and resolve data issues with end-to-end observability across pipelines.
Explore ADM
Agentic Data Engineering
Lorem ipsum dolor sit amet, consectetur adipiscing elit. Suspendisse sollicitudin mi nibh
Explore ADE
Data Warehousing
AI-powered observability and optimization for Hadoop and big data environments.
Explore Data Warehousing


ML & AI Applications
Lorem ipsum dolor sit amet, consectetur adipiscing elit. Suspendisse sollicitudin
Explore ML & AI Applications


Data & AI Observability
Lorem ipsum dolor sit amet, consectetur adipiscing elit. Suspendisse so
Explore Business Applications
Open Data Platform
An open-source data platform for Hadoop modernization, flexibility, and long-term control.
Explore ODP
ADM | Visualization
One-click Dashboards.
Zero Dependencies.
One-click visuals from natural language — no SQL, no engineering ticket, no wait.

TRUSTED BY ENTERPRISE DATA TEAMS WORLDWIDE


Built for every team that lives in the data.

Ask in plain language
Conversational Queries · Inline Visuals
Conversational Queries · Inline Visuals
Ask. Visualize. Done. Interactive dashboards generated from your question — linked to the conversation thread for context.

Understand the flow
Asset Lineage · Download · Edit
Asset Lineage · Download · Edit
Ask what feeds a table, what a pipeline touches, or what breaks when an asset changes. ADM renders the lineage map — ready to download and share.

Save what matters
Metrics Explorer · LLM Widgets
Metrics Explorer · LLM Widgets
Build widgets without SQL. Line, bar, dual-axis, scatter — generated from a single request. Assemble them into your own dashboard views.

Ship it as a Dashboard.
One-Click · Live Data
One-Click · Live Data
KPIs and charts pull live from your governed data layer — the whole team sees fresh data without re-running anything.
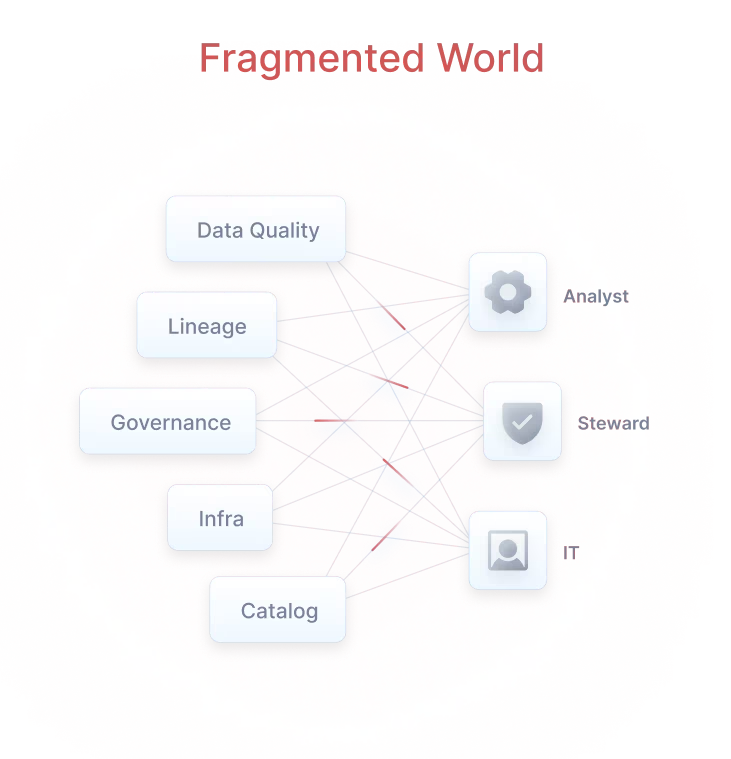
One platform. Every role.
Multiple Roles. Converged Intelligence

Ready to get started
Explore all the ways to experience Acceldata for yourself.
