



.svg)



Key Takeaways
- A multi-engine data estate uses separate engines for batch processing, federated queries, streaming, and embedded analytics, a model that is increasingly common across enterprise data teams.
- Monitoring breaks down because each engine reports its health differently, leaving dashboards to collect telemetry without translating it into a unified view.
- With Flink and Trino side by side, “failed” can mean two very different things: a Flink job that recovered from a checkpoint and a Trino query that has stopped and is visible to users.
- Multi-engine observability adds a layer above the engines, sorting every failure into one shared model and tracking data between them.
Running Spark for batch, Trino for federated queries, Flink for streaming, and DuckDB in your notebooks makes for a capable data stack. However, it also leaves you with separate dashboards that completely disagree on what a "failed job" actually means.
The problem is that every engine speaks its own language. To Flink, a restart is just a routine recovery. But in Trino, a query failure means an actual user is actively staring at an error screen. So, when a pipeline breaks, the on-call engineer gets stuck translating between these different metric vocabularies by hand (all while bad data keeps moving downstream).
You shouldn't have to bridge those gaps just to diagnose an issue manually. That’s exactly why multi-engine observability exists.
In this article, we’ll look at where these engine-to-engine mismatches come from, and what it takes to normalize them into a single, unified view.
What Makes a Multi-Engine Data Estate Different From a Multi-Tool One
A multi-tool data estate links separate software across sequential pipeline stages, and each tool hands its output to the next tool in line. A multi-engine estate works on a different principle, since several compute frameworks, such as Spark, Flink, and Trino, run directly against the same underlying data, and the table below shows how that change reshapes the comparison.
Where Engine-Level Semantic Mismatch Shows Up
Every specialized data engine in your stack is built for a distinctly different type of workload, forcing them to measure performance and failure using entirely different vocabularies. This architectural reality creates a massive translation barrier: diagnostic metrics from one system simply cannot map to the next.
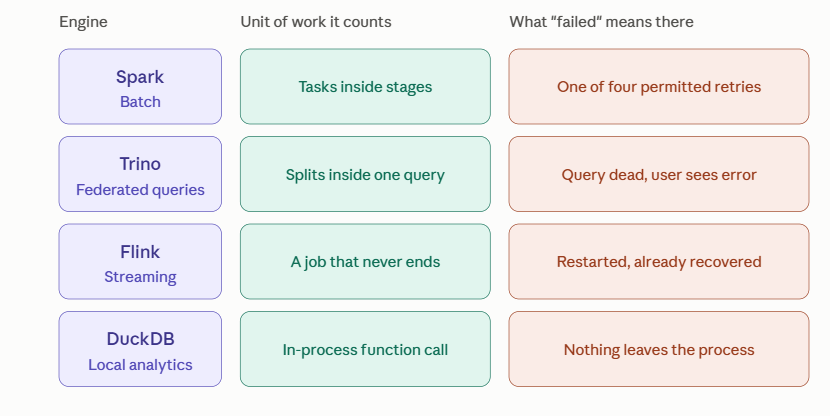
To see why a single dashboard can't seamlessly merge these, we have to look at how these disjointed dialects show up across four different execution models.
1. How Spark counts work and failure
Everything Spark reports describes distributed task execution, from executor counts and shuffle volumes to task duration distributions, GC time, and disk spill. Skew is the classic read: a few tasks running an order of magnitude longer than the median while the rest finished long ago.
Failure, though, is layered. Because spark.task.maxFailures defaults to four, a task has to fail four times before it takes down its stage, and the stage has to fail before the job does. That leaves you choosing between alerting on task failures, which is mostly noise, and alerting on job failures, which arrives after the damage.
2. How Trino counts work and failure
Trino was built for interactive and federated querying, and its metrics follow from that. Query time breaks into queued, analysis, planning, and execution phases, while splits, the units of work handed to workers, are counted as queued, running, or completed.
None of this maps onto Spark. A split isn't a task, and queue time in Trino reflects admission control rather than a cluster manager holding a job back. Adding a Trino data source integration extends the metrics further still, out into the systems Trino reaches into, which is a dimension that Spark doesn't have.
3. How Flink counts work and failure
Flink measures health in terms that have no batch equivalent. Checkpoint duration and alignment time show whether the job can snapshot its state fast enough to keep pace, while watermark lag shows how far the job has fallen behind event time. Restart count simply tracks how often the job has recovered from a checkpoint.
That restart count is exactly where generic alerting breaks down, because a checkpoint restart is recovery working as designed, not a failure. Wire an alert to that counter, and an engineer gets paged every time the system does its job correctly.
4. Why DuckDB reports almost nothing
DuckDB has no coordinator, no workers, and nothing external to poll. It runs inside whatever process imported it, whether that is an analyst's notebook or a container executing one step of a pipeline, so its resource use shows up only as that process's resource use, nothing more.
Profiling does exist through EXPLAIN ANALYZE within the session, but it vanishes the moment the session ends. The result is that an observability model built around pollable endpoints cannot register that DuckDB ran at all, even though the workload consumed real resources and fed something downstream.
Why Doesn't a Centralized Dashboard Fix Multi-Engine Monitoring?
A centralized dashboard doesn't fix multi-engine monitoring, since it only changes where metrics live and never what they mean. Four core problems survive that move, and each one traces back to the vocabulary each engine used long before the metrics were ever combined into one store.
- Per-engine thresholds: Thresholds still need per-engine tuning, since a p99 latency rule built for Trino means nothing for a continuous Flink stream, and Spark failure thresholds fit neither one.
- Incomparable severity: Severity cannot be compared across engines, so centralized views default to sorting alerts by timestamp instead of by actual business impact.
- Fragmented expertise: Interpreting alerts still demands four kinds of expertise, since an on-call engineer must instinctively know which engine's errors heal themselves and which ones end the job.
- No cross-engine lineage: Nothing actually follows the data across engines, so a monitoring layer can flag which component failed but never reveal which downstream report is now wrong.
What Real Multi-Engine Observability Needs to Normalize
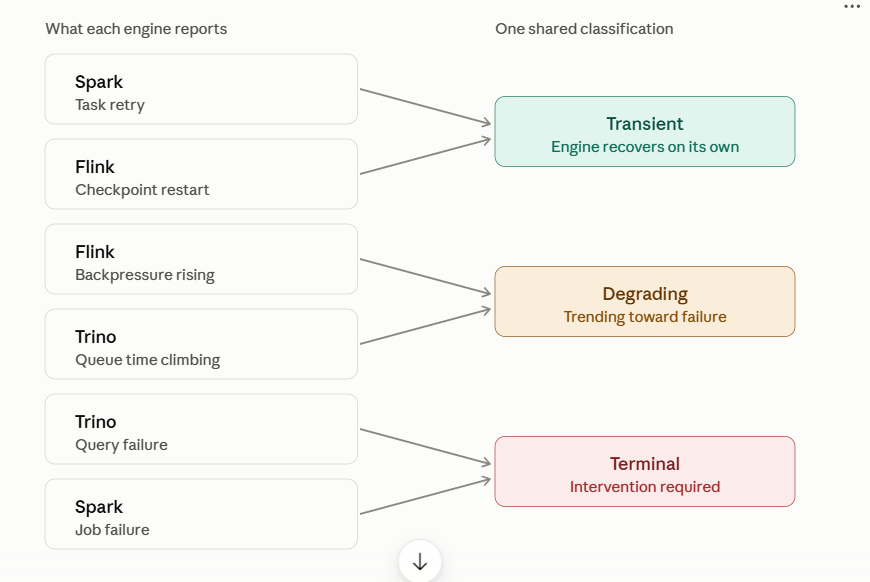
Real multi-engine observability needs to normalize two things: a common failure taxonomy across engines, and a shared view of how data moves between them. Each level covers a gap the other leaves open.
1. A common failure taxonomy
Every engine's failure modes need to map onto a shared set of categories that hold the same meaning regardless of which engine produced the event. Under that model, a Spark task retry and a Flink checkpoint restart both classify as transient, while a Trino query failure and a Spark job failure both classify as terminal. Each engine continues speaking its own language internally, and triage gains its own language.
2. A shared view of data flowing across engines
Imagine a Spark job writes a table, Trino reads it to serve two dashboards, and Flink reads it to enrich a stream. Right now, every engine refers to that same table by its own internal name, completely unaware that the other two even touched it.
Data lineage resolves those conflicting names into a single asset, tracking exactly who wrote it and who read it. With it, you instantly know the table is stale, both dashboards are displaying yesterday's numbers, and Flink is actively enriching streams with bad data.
That is the difference between basic compute monitoring, which only tells you an engine is unhealthy, vs. multidimensional data observability, which tells you exactly which numbers are now wrong.
How Does Running Spark, Trino, and Flink on Kubernetes Change Observability?
Running Spark, Trino, and Flink on Kubernetes changes observability by adding a shared infrastructure layer, the first genuinely common vocabulary across the entire data estate, since Kubernetes lifecycle events describe every engine's pods in identical terms regardless of what each engine is actually doing.
That shift matters because Kubernetes is where most of these engines already run. CNCF's 2025 annual survey put 82% of container users on Kubernetes in production, so for most data teams the multi-engine problem and the Kubernetes problem are the same.
Because Spark executors, Trino workers, Flink task managers, and even DuckDB pipeline steps all run as pods, this infrastructure layer surfaces a single set of terms that applies no matter which engine is underneath.
The signals worth correlating at this layer include:
- Pod evictions and OOMKills: These explain ambiguous engine-level failures. If a Spark executor disappears and a Flink task manager restarts, Kubernetes reveals that both actually traced back to a single node exhausting its memory.
- Node pressure and scheduling delays: A pod stuck in a pending state is a queue-time problem. This surfaces as an admission delay in Trino and a slow executor ramp-up in Spark, two different engine symptoms pointing to the same underlying cause.
- Resource requests vs. actual usage: Over-provisioned pods hoard capacity that other engines can't access. This is exactly how a resource misconfiguration in one engine silently degrades the performance of another.
However, Kubernetes correlation supplements engine-level semantics but doesn't replace them. Pod health says nothing about checkpoint alignment, query queue depth, or shuffle skew. A Kubernetes-native data platform supplies the shared substrate, with the engine-level layer sitting above it and the data layer above that.
What a Unified View Looks Like in Practice
A unified view shows one incident instead of four alerts, with a cause attached and everything downstream of it already listed.
The engineer on call sees one incident carrying a cause and a blast radius, which removes the reconstruction work that four separate dashboards demand. Producing that view requires an observability layer above the engines that normalizes failure semantics and tracks data across engine boundaries.
Agentic data observability works at that level, treating cloud, hybrid, and on-premises data as one connected layer instead of a set of per-engine monitoring surfaces.
Acceldata brings this to your Spark, Trino, Flink, and DuckDB estate directly, correlating failures and lineage into one incident view instead of four disconnected screens.
See a self-guided product demo to see how it works on an estate like yours.
Closing the Multi-Engine Observability Gap With Acceldata
Four engines will not reconcile themselves. Spark, Trino, Flink, and DuckDB each measure only what their own execution model makes measurable, and centralized storage cannot align vocabularies built to differ.
Acceldata's xLake platform closes that gap with one connected layer across cloud and on-premises engines.
- Cross-engine observability normalizes every failure signal into one shared model.
- Data lineage traces each table from write to every downstream read.
- One incident view replaces four alerts with a single root cause and blast radius.
See your own Spark, Trino, Flink, and DuckDB estate this way. Book a demo with Acceldatatoday.
FAQs: Multi-engine Observability
How do you set severity when a Flink job and a Trino query fail at the same time?
Severity should reflect user impact, business criticality, failure duration, and whether either system has recovered automatically. A failed Trino query that immediately affects users may warrant higher severity than a Flink job that has automatically recovered from a checkpoint with no lasting impact.
Is DuckDB worth monitoring the same way as a distributed engine like Spark or Trino?
DuckDB generally does not require the same monitoring depth as distributed engines like Spark or Trino because it runs primarily as an embedded, single-node analytical engine. Monitoring is still valuable for query failures, execution time, memory usage, and resource consumption, particularly when DuckDB supports production workloads or user-facing applications.
How does data lineage work across engines that don't share a catalog?
Data lineage across engines without a shared catalog is typically built by correlating metadata from each engine with a central lineage layer. It tracks datasets, queries, jobs, and transformations across systems so dependencies remain visible even when Spark, Trino, DuckDB, and other engines maintain separate catalogs.
Does adding more engines always mean adding more observability overhead?
Adding more engines can increase observability overhead because each engine may expose different metrics, logs, failure states, and metadata. However, a unified observability layer can reduce the incremental effort by standardizing telemetry and presenting engine-specific signals in a common framework.
What's a reasonable first engine to unify observability for if you can't do all four at once?
A reasonable first engine is usually the one with the highest production criticality, workload volume, or user impact, since it provides the greatest observability value. For many organizations, that means starting with Spark or Trino and then extending the same framework to the remaining engines.