


Key Takeaways
- AI observability monitors model and agent behavior, while data observability tracks the health of the pipelines and datasets feeding them.
- Healthy model metrics cannot rule out upstream data issues that cause incorrect AI outputs.
- Disconnected monitoring, delayed alerts, and unclear ownership widen the gap between incident detection and resolution.
- Shared root cause analysis connects AI symptoms to upstream data failures through lineage mapping, event correlation, and data quality diagnostics.
- Automated remediation, such as Acceldata's Resolve, connects anomaly detection to defined responses and reduces manual handoffs.
Your AI assistant starts giving customers incorrect answers at 2 a.m., and the ML team spends hours confirming the model is healthy before anyone checks the input data. That is the cost of treating AI observability vs. data observability as interchangeable: the wrong team investigates, the incident escalates, and recovery stalls.
The time it takes to resolve the issue keeps widening because each layer sees only its own part of the failure. Closing that resolution gap takes both layers sharing context, which is the case for running them together.
Difference Between AI Observability and Data Observability
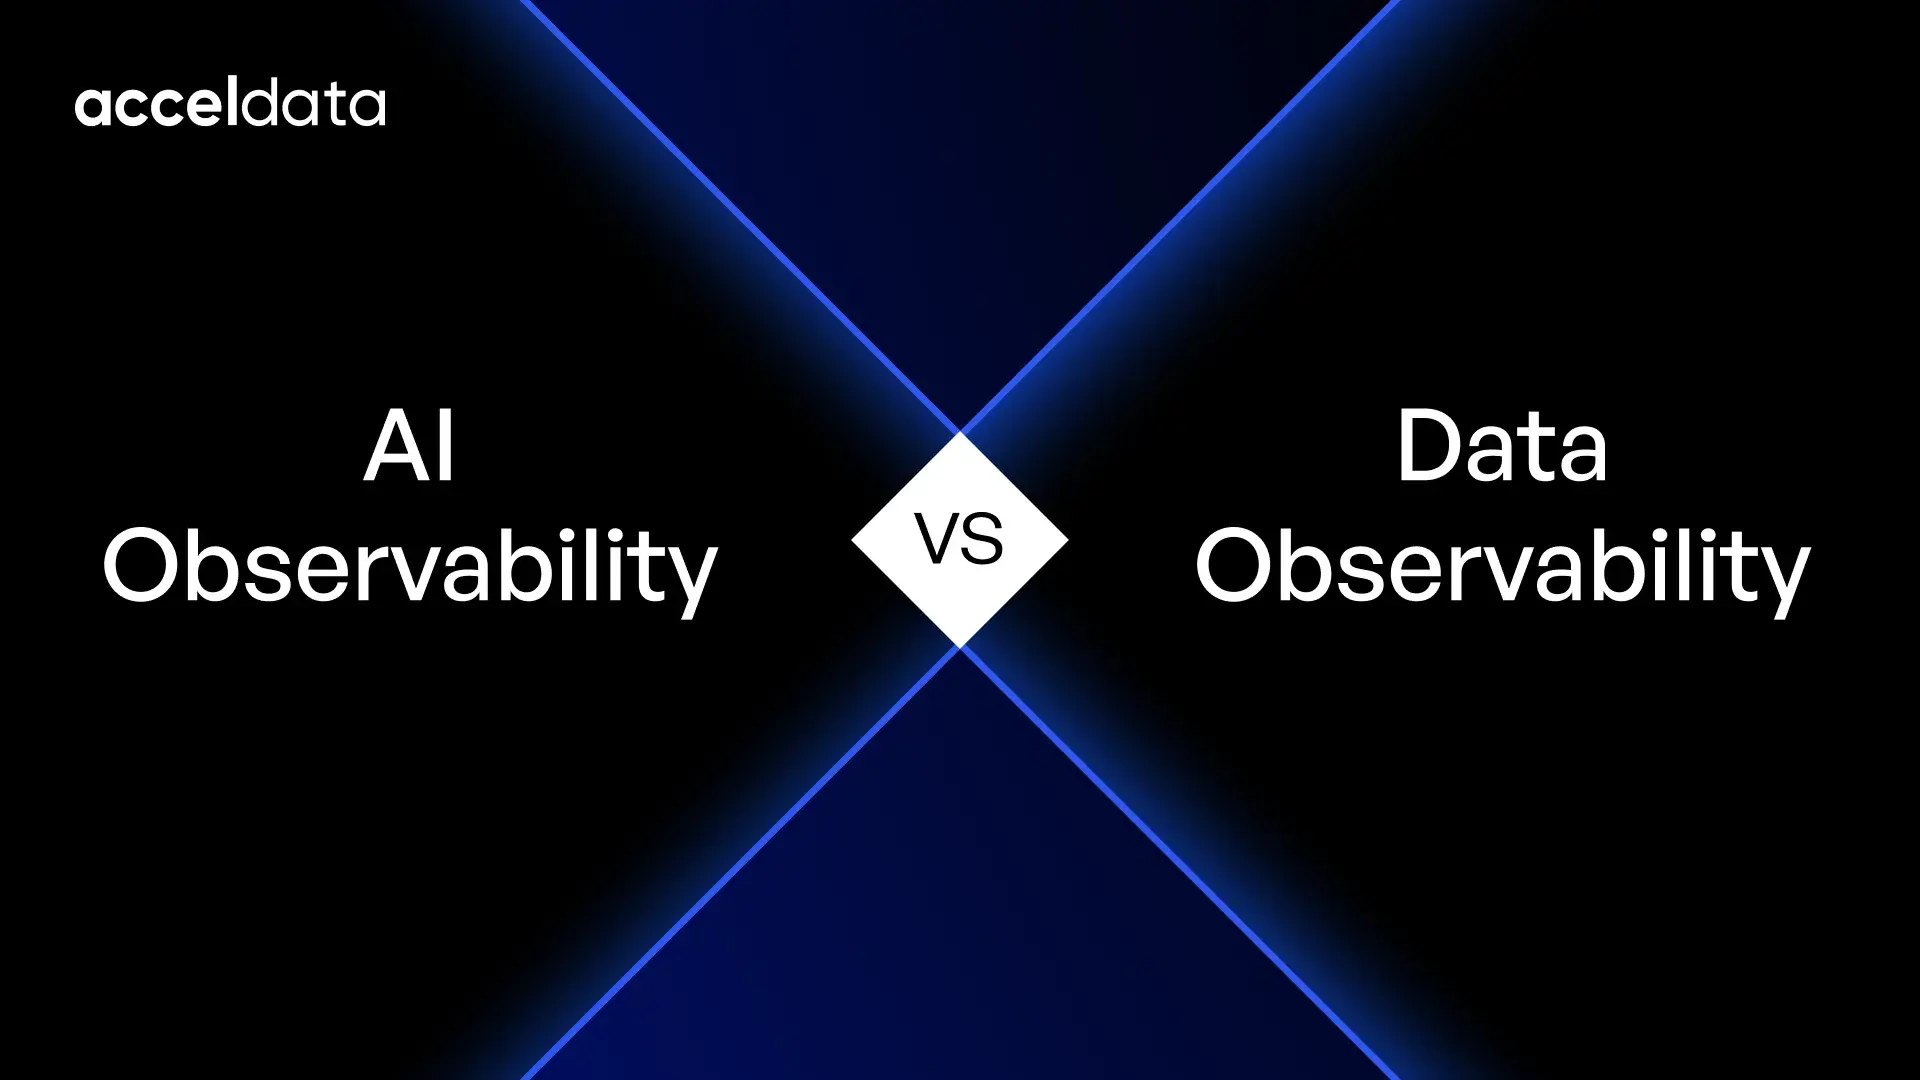
In the AI observability vs. data observability comparison, AI observability is the practice of monitoring a model or agent's behavior, including prompts, outputs, latency, cost, and drift, while data observability is the practice of monitoring the health of the pipelines and datasets that feed that model or agent.
The table below compares them.
Neither term describes the other's layer, so comparing them as competitors misses the point, and the deciding factor is how quickly both layers share context during incidents.
Why Doesn't AI Observability Alone Catch a Data Problem Before it Reaches a Model or Agent?
AI observability alone cannot catch a data problem before it reaches a model or agent because it watches what the model does with the data, not whether that data was correct, complete, or current, so a clean AI observability dashboard can sit directly downstream of a broken pipeline.
Consider an agent that approves a refund using a customer record left 14 hours stale: its prompts, outputs, and tool calls all look normal, while the stale record and failed sync job sit beyond what AI observability tracks.
What looks like a model failure is often a data problem wearing a model's face, so retuning prompts or swapping models would change nothing.
Why is Data Observability Necessary But Not Sufficient for an AI-Ready Enterprise?
Data observability is essential for an AI-ready enterprise because every AI system depends on trusted data, but healthy pipelines alone cannot guarantee reliable AI outcomes or reveal how consuming models and agents behave.
Acceldata's AI Readiness & Data Management Benchmark Report (2025) found that only 18% of surveyed data leaders were satisfied with both the accuracy and completeness of their critical data assets, while 32% reported dissatisfaction and 50% were unsure or did not measure it. These findings highlight a significant gap in enterprise data trust.
Pipelines alone miss three failures:
- Bad prompt: A flawed instruction produces wrong outputs even with clean input tables.
- Regressive model update: A new version can degrade answers while pipelines report full health.
- Misconfigured tool call: An agent can call the wrong tool or parameters without a pipeline metric flagging it.
That starting point is why data observability defines AI-ready enterprises, yet it misses these.
What is the Resolution Gap Between Detecting an AI Incident and Resolving It?
The resolution gap is the time and effort lost between an alert firing in one system and a team confirming the actual cause in another, and it is widest where AI and data observability meet, since the two tools rarely share a view of lineage.
Better incident triage across data lakes and streams shortens that gap, and the following patterns explain why triage stalls when AI and data alerts fire together.
Batch versus streaming triage
A batch pipeline loads data in scheduled chunks, while a streaming pipeline processes events continuously, so each surfaces problems on a different clock.
A bad batch load may not show up until the loading window closes, yet the agent acts on whatever data it has and fires its alert within seconds. With model and pipeline alerts arriving at different times, engineers cannot tell which is the cause, and triage stalls until someone lines up timestamps by hand.
Disconnected monitoring stacks
Teams commonly run infrastructure, data pipeline, and AI behavior monitoring in separate tools, so they open each console to check health.
When the pipeline console shows a stale table alert, the AI and infrastructure consoles can still show green. Without a view of the chain from table to output, the root cause stays hidden, and time is lost building that chain by hand.
Ownership disputes
A payment system introduces a new status that the sync job misinterprets, triggering an AI alert that falsely reports a doubling of refunds. The ML team finds no issues with the model, while the data team sees only green pipeline checks.
With neither team accepting responsibility, the platform lead must step in. Without shared lineage, each handoff forces the teams to repeat parts of the investigation, prolonging the incident as they debate ownership.
How Does Shared Root Cause Analysis Close the Gap Between AI Observability and Data Observability?
Shared root cause analysis closes the gap by tracing a single incident across both layers at once, from a model's flagged output back through table-level and column-level lineage to the exact upstream event that caused it.
The following mechanisms make that cross-layer trace possible, so two teams no longer compare screenshots:
- Dependency and lineage mapping: Maps relationships between models, datasets, and upstream pipelines so teams can trace an unexpected output to the affected data source.
- Event and anomaly correlation: Connects model alerts with upstream data anomalies and pipeline events to establish whether seemingly separate signals belong to one incident.
- Machine learning-driven inference: Analyzes connected signals and patterns to identify likely root causes across both layers, which reduces reliance on manual comparison.
- Schema and data quality diagnostics: Detects schema changes, freshness issues, and missing values to give teams concrete evidence of whether an upstream data issue caused the model's unexpected behavior.
Together, these turn disconnected signals into a traceable chain of evidence. By detecting root causes in modern data pipelines, teams move beyond seeing where an incident surfaced to understanding why it occurred.
The same idea appears in how Acceldata built ADM to make data observability conversational, where overlaying data quality scores with record volume let the system identify a root cause automatically.
How Can Teams Move From Alert Fatigue to Automated, Cross-Layer Remediation?
Teams move past alert fatigue by unifying metrics, logs, traces, and data lineage into one signal instead of triaging separate alert streams by hand, then letting an agent suppress noise, correlate related issues, and take a pre-approved corrective action under policy guardrails.
Alert fatigue, meaning too many disconnected alerts, widens the resolution gap, so three shifts close it:
- Unifying incident signals: Connect metrics, logs, traces, and lineage so related alerts arrive as one correlated incident with context across every layer.
- Enabling guarded agent actions: Let agents suppress noise and correlate incidents, with every corrective action pre-approved under clear policy guardrails.
- Measuring resolution: Mean Time to Resolve (MTTR) shows how quickly you fix an incident, so tracking it alongside Mean Time to Detect (MTTD) shifts the focus from detection to resolution.
Cross-platform visibility speeds up the detection half of that equation: a global pharmaceutical leader achieved an 85% MTTD improvement with cross-platform data observability from Acceldata.
The path from alert fatigue to automated remediation then runs through connecting every signal to a corrective action, shortening the route from detecting an incident to resolving it across both layers.
How Does Autonomous Resolution Close the Gap Between AI and Data Observability in Practice?
Autonomous resolution closes the gap between AI and data observability by acting the moment a cross-layer root cause is confirmed, rather than handing a fully diagnosed incident back to a human queue.
See how Acceldata's Resolve puts this into practice: it combines continuous monitoring and autonomous action in a five-stage workflow of monitor, detect, route, trigger, and learn, watching data health, volume, freshness, and schema drift, then using role-based playbooks to stop pipelines, create tickets, alert teams, and route incidents to owners.
Its autonomous resolution of data incidents capability connects anomaly detection with defined operational responses. Tracking failed remediation attempts and recurring incidents then reveals weaknesses in response logic, and recurring incidents with clear recovery criteria are the best first candidates to automate before extending to complex scenarios.
Closing the Resolution Gap Between AI and Data Observability with Acceldata
A team can run best-in-class AI observability and data observability side by side and still take hours to resolve an incident, because resolution needs both layers looking at the same lineage at the same time, which two dashboards compared by hand cannot provide.
To close the gap, teams should:
- Map lineage across the model, agent, and data layers before an incident, not during one.
- Route AI and data alerts through one correlation point instead of two.
- Measure Mean Time to Resolve (MTTR) across both layers as a single number.
- Keep a human approval checkpoint for any automated action that could affect critical workloads or business operations.
Acceldata's xObserve brings pipeline health, data quality, and LLM tracing into one observability layer, and its Resolve capability acts on what is detected through role-based playbooks, so detection and response sit in one workflow.
Book a demo and see how Acceldata closes the resolution gap between AI observability and data observability in one workflow.
Frequently Asked Questions
Do you need both an AI observability tool and a data observability tool, or can one replace the other?
Yes, most teams need both an AI observability tool and a data observability tool, because neither replaces the other. With budget for only one this quarter, start with the layer carrying your biggest operational risk, and check whether existing tools already cover the other.
Which team should own an incident that spans both the AI layer and the data layer?
An incident that spans both the AI layer and the data layer should be led by the team responsible for the affected production service, with a designated incident owner coordinating the response. Data engineering investigates pipelines, AI/ML engineering examines model behavior, and SRE supports reliability.
How is agent observability different from both AI observability and data observability?
Agent observability tracks decisions, tool calls, task sequences, and handoffs, while AI observability examines model behavior, prompts, outputs, latency, and quality, and data observability monitors freshness, volume, schema, and quality of the underlying data. Together, they show what the agent did, how the model performed, and whether its data was trustworthy.
What is the fastest way to tell whether an AI incident's root cause is in the model or in the data?
The fastest way to tell is to rerun the same model and prompt with a known-good input: if the output improves, investigate upstream data, and if the issue persists, examine model versions, prompts, and inference settings. This is a starting point rather than proof, since data and model issues can coexist.
Does closing the resolution gap require replacing existing observability tools?
No, closing the resolution gap does not require replacing existing observability tools, since shared metadata, lineage, alert integrations, and incident-management workflows can often connect them. Identify where context gets lost between systems, and consider replacement only if the current stack cannot provide the coverage, correlation, or controls you need.