


.svg)


Introduction: Impala evolution
Apache Impala, first developed and released in 2012, was designed to bring low-latency SQL analytics to the Hadoop ecosystem. Unlike traditional batch engines like MapReduce, Impala was built to support interactive, real-time queries over massive datasets stored in HDFS and HBase.
The Evolution of Impala
- 2012 – Conception: Impala emerged as a revolutionary MPP (Massively Parallel Processing) SQL engine for Hadoop. It allowed analysts to run queries directly on data stored in HDFS without data movement or transformation.
- 2015 – Enterprise Adoption: With enhanced support for Hive UDFs, security (Kerberos/Sentry), and integration with Hive Metastore, Impala gained traction in production environments. Enterprises started using it for dashboarding, reporting, and BI workloads.
- 2017 – Integration with Apache Arrow & Kudu: Impala introduced support for Apache Kudu (for real-time inserts/updates) and began leveraging Apache Arrow for faster in-memory data transfers, improving performance dramatically.
- 2020 – Modernization & Ecosystem Harmony: Impala became a key component of the modern data platform, coexisting with Hive, Spark, and Kafka. It added support for ACID transactions, complex types, S3/ABFS object stores, and improved concurrency through resource pooling.
- Today – Cloud-Ready, Real-Time Analytics Engine: Impala now powers cloud-native analytics with support for Kubernetes-based deployments, external catalogs (Iceberg, Delta Lake), and hybrid cloud use cases. It remains the go-to choice for sub-second query performance on petabyte-scale datasets.
Understanding Impala query flow
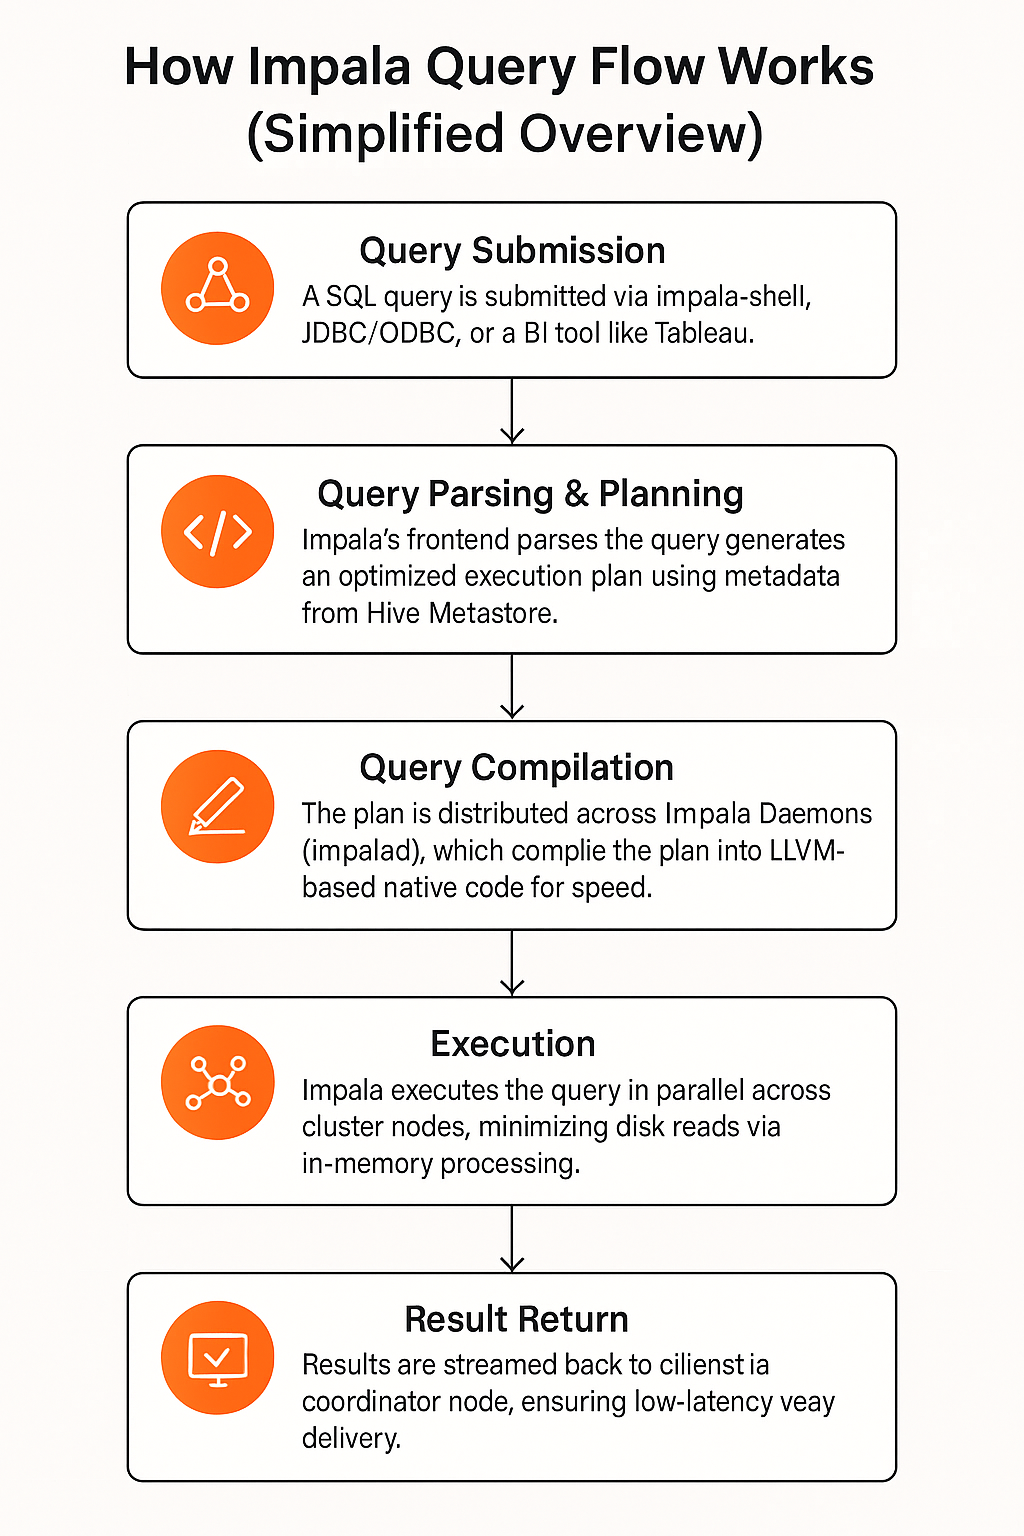
How Impala Query Flow Works (Simplified Overview)
- Query Submission: A SQL query is submitted via Impala-shell, JDBC/ODBC, or a BI tool like Tableau.
- Query Parsing & Planning: Impala’s frontend parses the query and generates an optimized execution plan using metadata from Hive Metastore.
- Query Compilation: The plan is distributed across Impala Daemons (impalad), which compile the plan into LLVM-based native code for speed.
- Execution: Impala executes the query in parallel across cluster nodes, minimizing disk reads via in-memory processing.
- Result Return: Results are streamed back to the client via the coordinator node, ensuring low-latency delivery.
Benefits of Using Acceldata Pulse to Troubleshoot Impala Queries
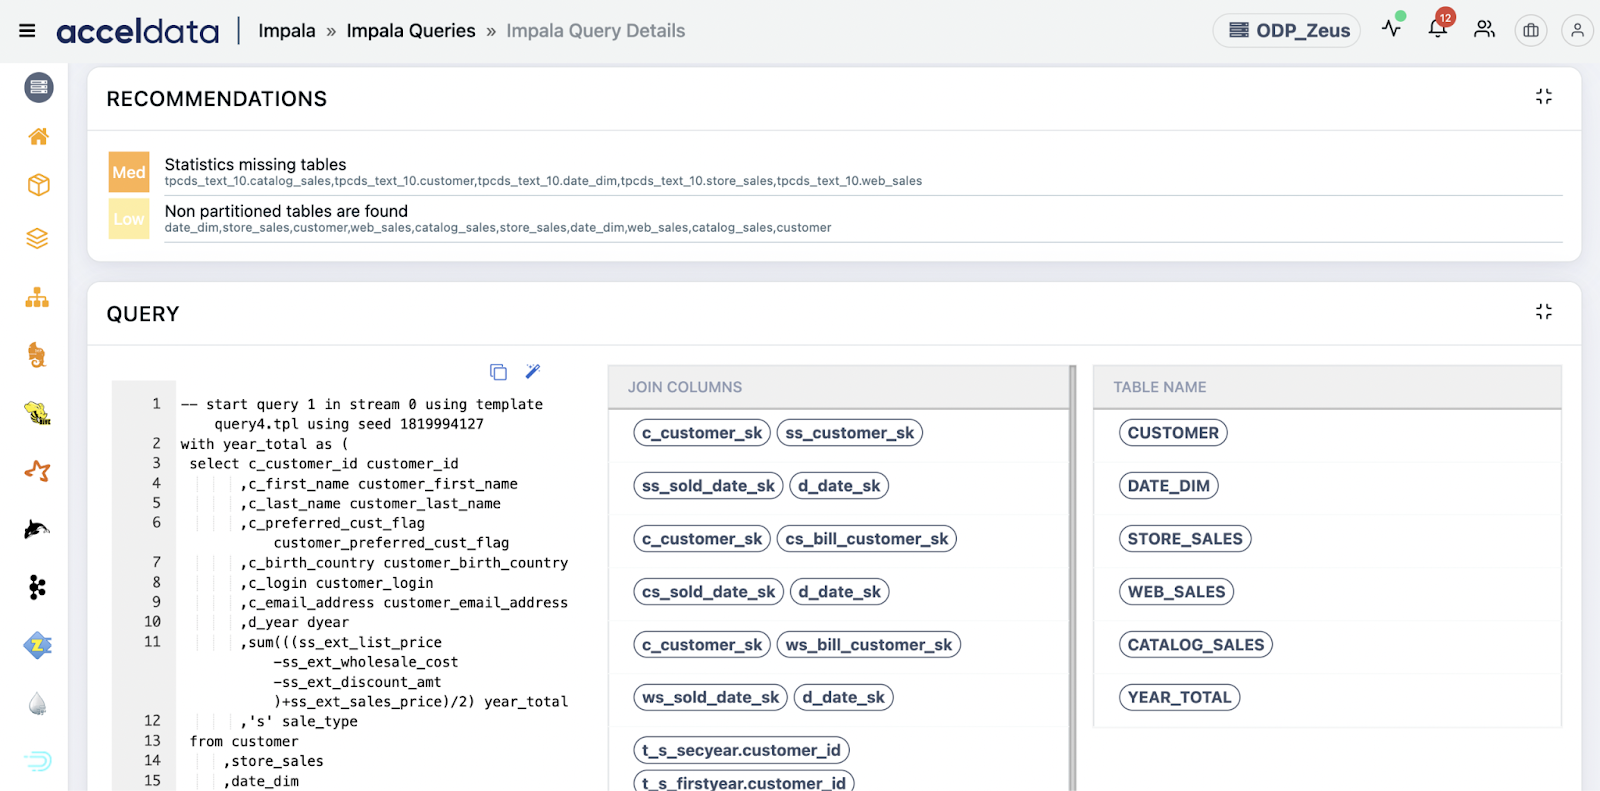
1. End-to-End Query Lineage and Dependency Mapping
What it does: Maps query flow across datasets, views, partitions, and dependencies.
Use Cases:
- Partition Scan Explosion: Query accesses all partitions due to lack of partition filter—lineage reveals where filter was missed.
- Orphaned Data Access: BI query accesses stale or deprecated partitions—lineage flags outdated data dependency.
- Multi-Table Join Errors: Highlights mismatched schemas or null key joins by showing table and field-level lineage.
- Data Pipeline Gaps: Detects missing upstream ingestion jobs when queries run on empty/missing data.
- Broken Views: Flags downstream queries depending on invalid Hive views that reference dropped columns.
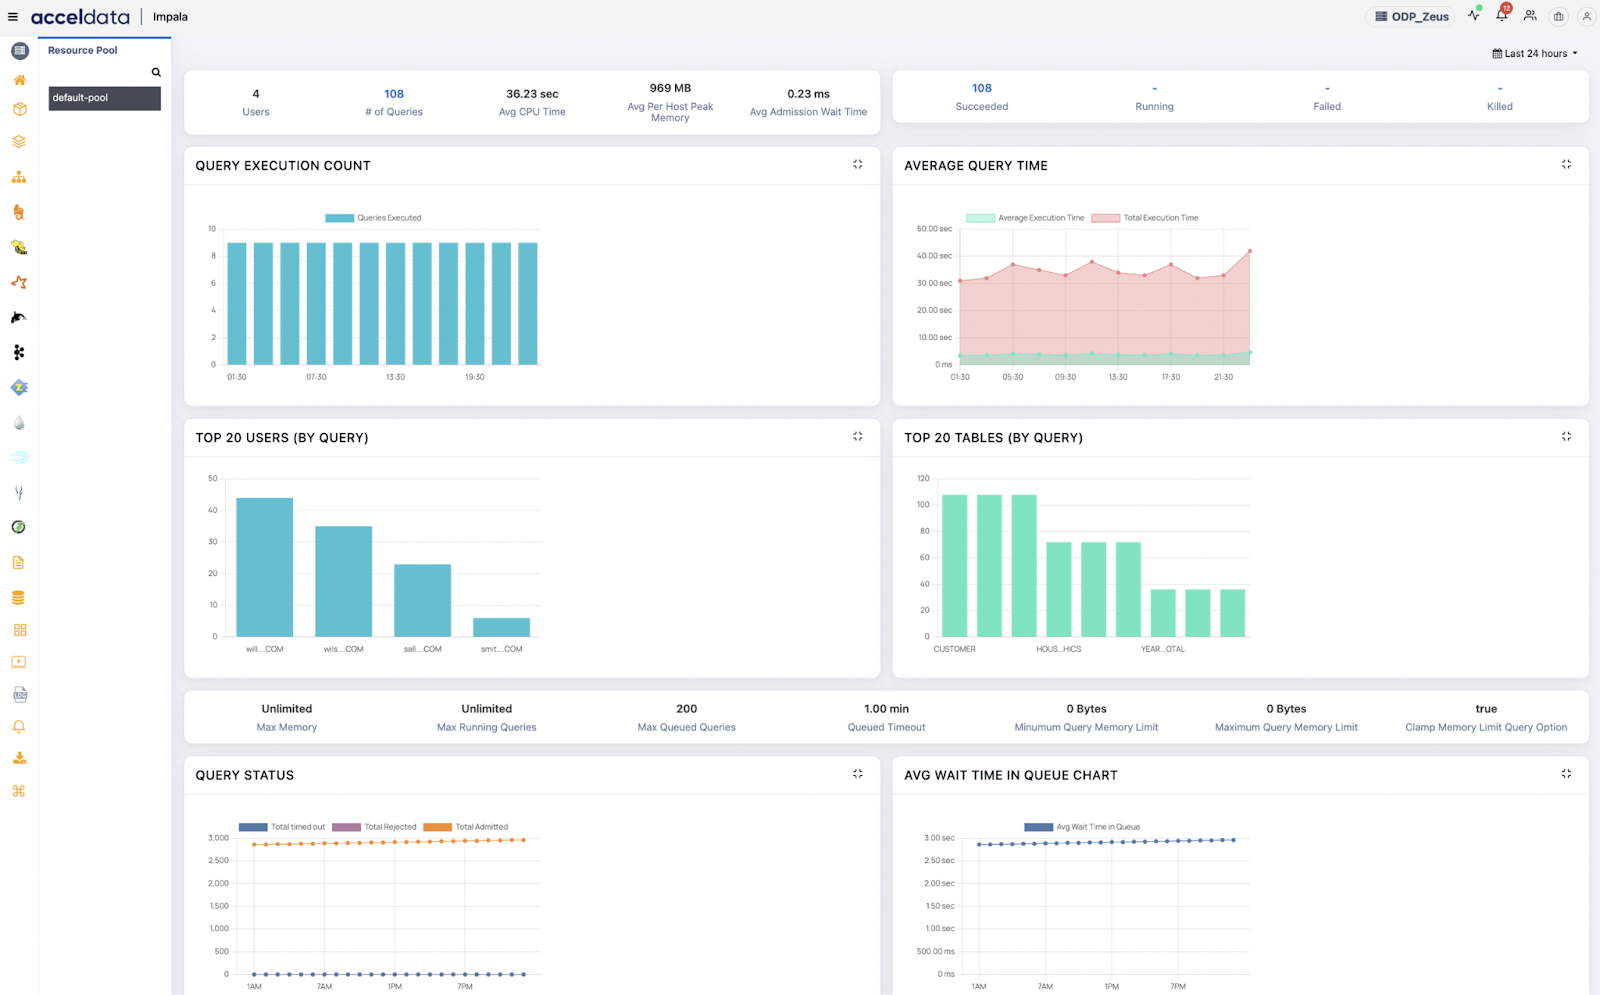
2. Real-Time Query Monitoring
What it does: Monitors live Impala query execution with full resource stats.
Use Cases:
- Query Memory Spike: Real-time alert when a query exceeds memory limits—prevents OOM failures.
- HDFS I/O Wait Detection: Identifies slow reads when DataNode disk latency spikes.
- Live Join Monitoring: Detects when a large table is being broadcast joined, causing memory pressure.
- Session Timeout Analysis: Real-time detection of sessions hanging due to inefficient aggregations or missing joins.
- Coordinator Node Bottleneck: Spotting high CPU/memory usage on the coordinator handling multiple queries.

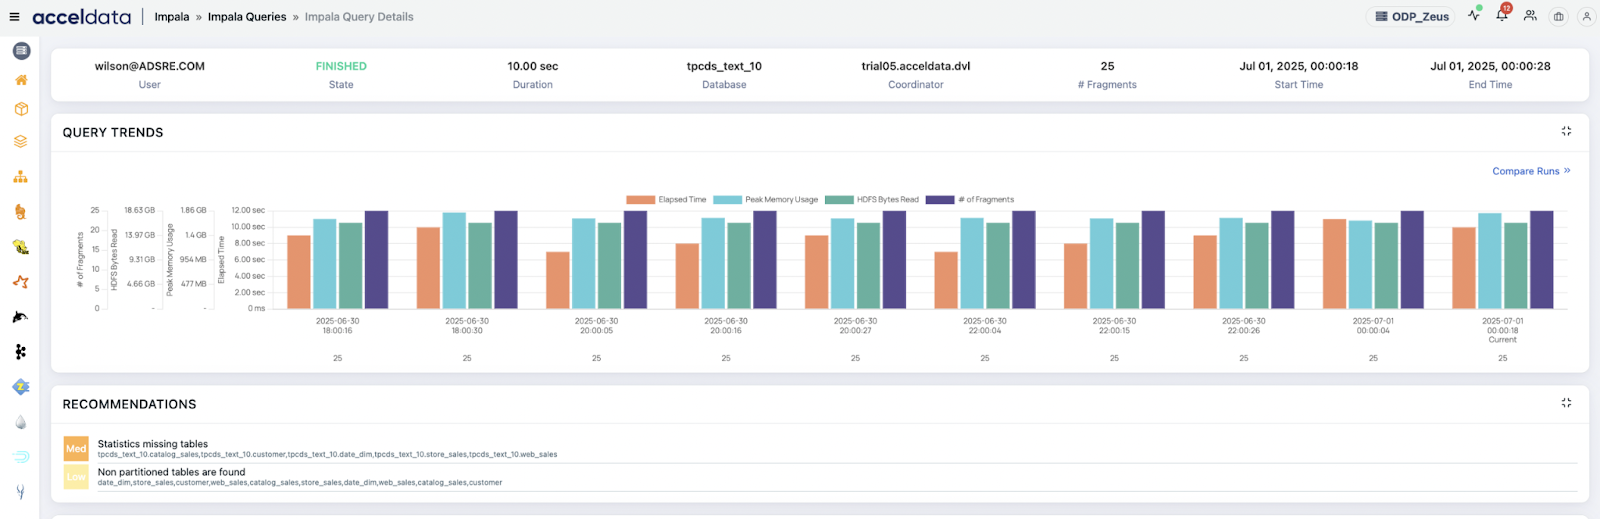
3. Historical Query Trend Analysis
What it does: Retains and compares past query performance for trend and regression analysis.
Use Cases:
- Query Regression Detection: A query that previously ran in 5s now takes 40s—trend clearly shows degradation post-deployment.
- Schema Change Impact: After a table is denormalized, execution time trend increases—historical view validates root cause.
- Workload Surge Analysis: Visualizes increase in average query concurrency during peak business hours.
- BI Dashboard Performance Drift: Tracks increased query latency after dataset size doubled.
- Improvements from Indexing or Optimization: Validates reduced scan size and duration after implementing optimization suggestions.
4. Automated Anomaly Detection
What it does: Uses ML to detect outliers in query behavior and usage patterns.
Use Cases:
- Unexpected Data Scan Spike: Query that usually scans 10 GB suddenly scans 1 TB—flagged automatically.
- Slowdown After Code Push: Identifies 3 queries with abnormal duration after ETL team pushed changes.
- Resource Starvation Alerts: Detects that queries are being queued longer due to high concurrency.
- Scan Size Discrepancy: Alerts when one user’s query scans 10x more data than others querying the same dataset.
- Newly Introduced Join Skew: Flags a query that suddenly starts using >80% cluster memory due to skewed joins.
5. Resource Utilization Correlation
What it does: Maps query performance to CPU, memory, disk, and network resource use.
Use Cases:
- CPU Bottleneck Correlation: Identifies top queries causing CPU saturation across Impala nodes.
- Memory Spike Root Cause: Connects cluster-wide memory usage to specific queries joining large datasets.
- Disk Throughput Issues: Matches long scan durations to high disk I/O latency on specific DataNodes.
- Network Saturation Diagnosis: Correlates poor broadcast join performance to intra-rack bandwidth saturation.
- Node Hotspot Detection: Finds queries consistently routed to overloaded nodes due to faulty load balancing.
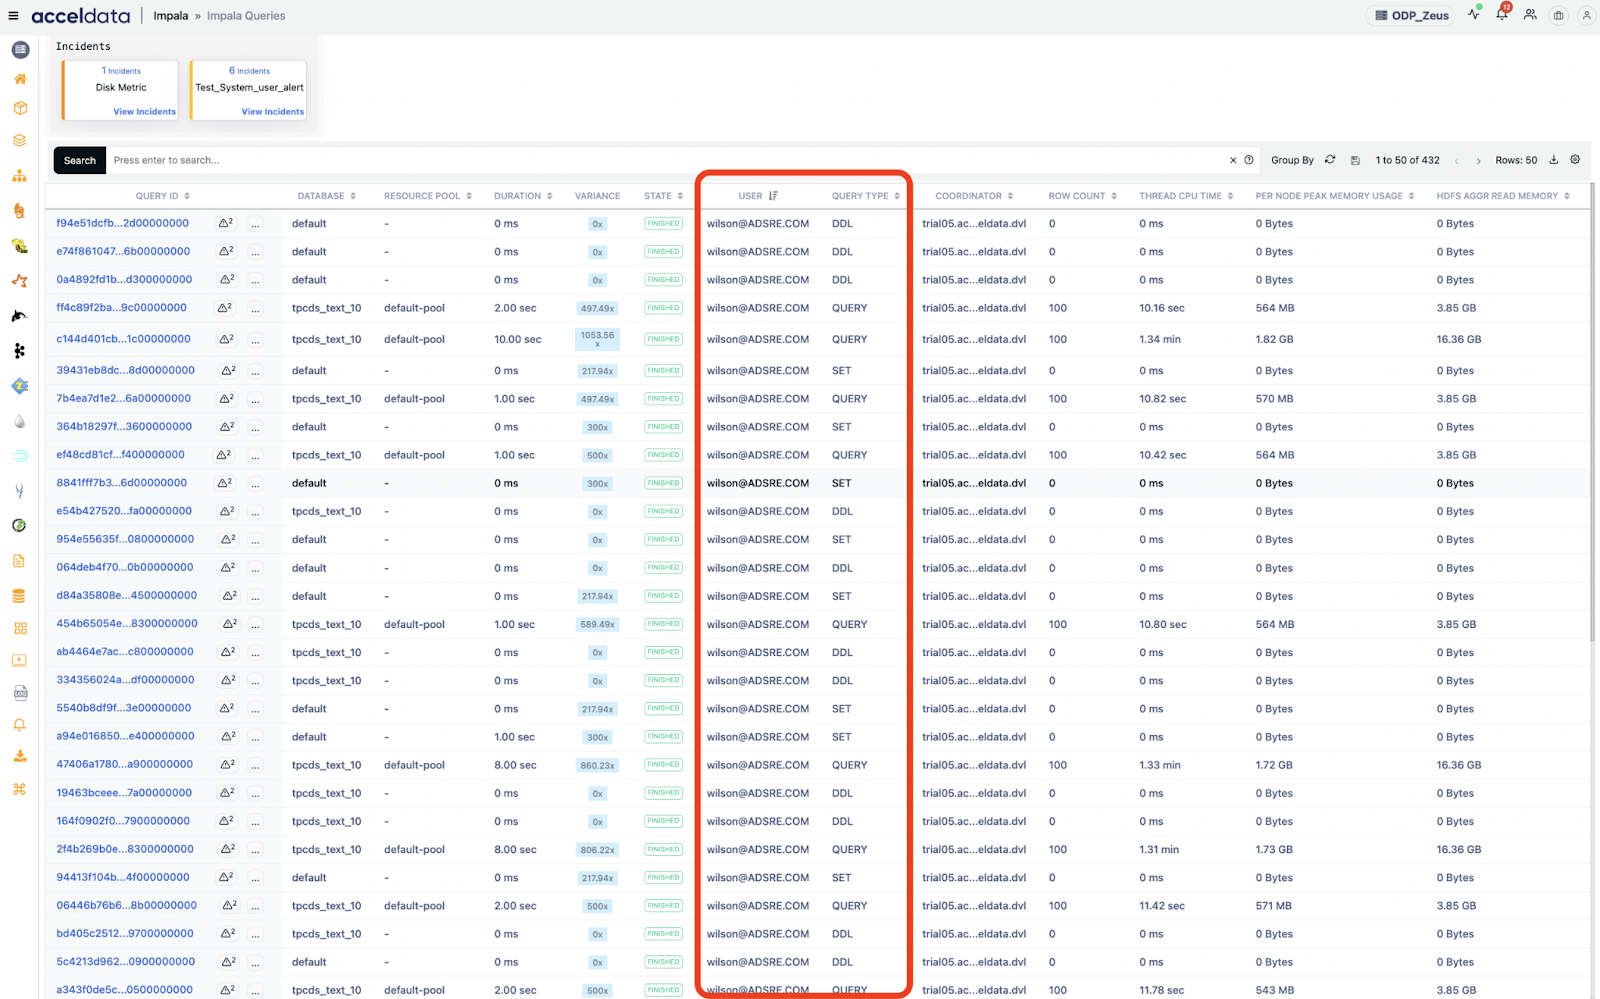
6. User-Level and Session-Level Insights
What it does: Analyzes query patterns, failures, and resource usage by users and sessions.
Use Cases:
- Top Resource Consumers: Highlights which users are consuming the most CPU/memory/disk I/O per day.
- Frequent Query Failures: Identifies sessions where users repeatedly run queries that fail due to syntax errors or timeouts.
- BI Tool Query Volume: Reveals Tableau or Power BI sessions flooding the system with high-frequency, low-impact queries.
- Misuse of Exploratory Queries: Detects users running exploratory SELECT * on large tables without filters.
- Long-Running Interactive Sessions: Flags users keeping sessions open for hours, occupying cluster memory unnecessarily.
7. Alerts and Recommendations
What it does: Sends alerts based on thresholds, anomalies, and provides optimization tips.
Use Cases:
- Long-Running Query Alert: Alert when a query exceeds 5 minutes + 10 GB scan threshold.
- Join Optimization Recommendation: Suggests switching from shuffle to broadcast join based on table size patterns.
- Partition Pruning Advice: Recommends adding partition filter when query accesses too many partitions.
- Queue Mismatch Alert: Notifies when a low-latency query is submitted to a low-priority queue.
- Auto-Suggested Resource Tuning: Proposes increasing heap size or thread pool based on historical metrics.

Monitoring Impala service and deamons
Pulse can also be used for monitoring Impala as a service just like all other services in a Hadoop cluster.
This can be explained better in a form of a table, explaining before and after scenarios of using Pulse:
Conclusion
In today’s data-driven landscape, performance and reliability are non-negotiable—especially when working with fast, distributed engines like Impala.
Acceldata Pulse empowers data teams with end-to-end observability, bridging the gap between query performance and infrastructure behavior. By providing deep visibility into Impala daemon metrics, real-time query profiling, and historical patterns, Pulse helps teams quickly identify bottlenecks, reduce mean time to resolution, and ensure SLAs are met consistently.
Whether you’re addressing slow queries, node-level issues, or capacity planning, Pulse transforms Impala troubleshooting from reactive firefighting to proactive optimization.
If you're looking to operationalize performance intelligence across your data stack, Acceldata Pulse is not just a tool—it’s your strategic advantage.
Schedule a demo today to see how Acceldata Pulse turns data performance challenges into a competitive edge.


