


.svg)


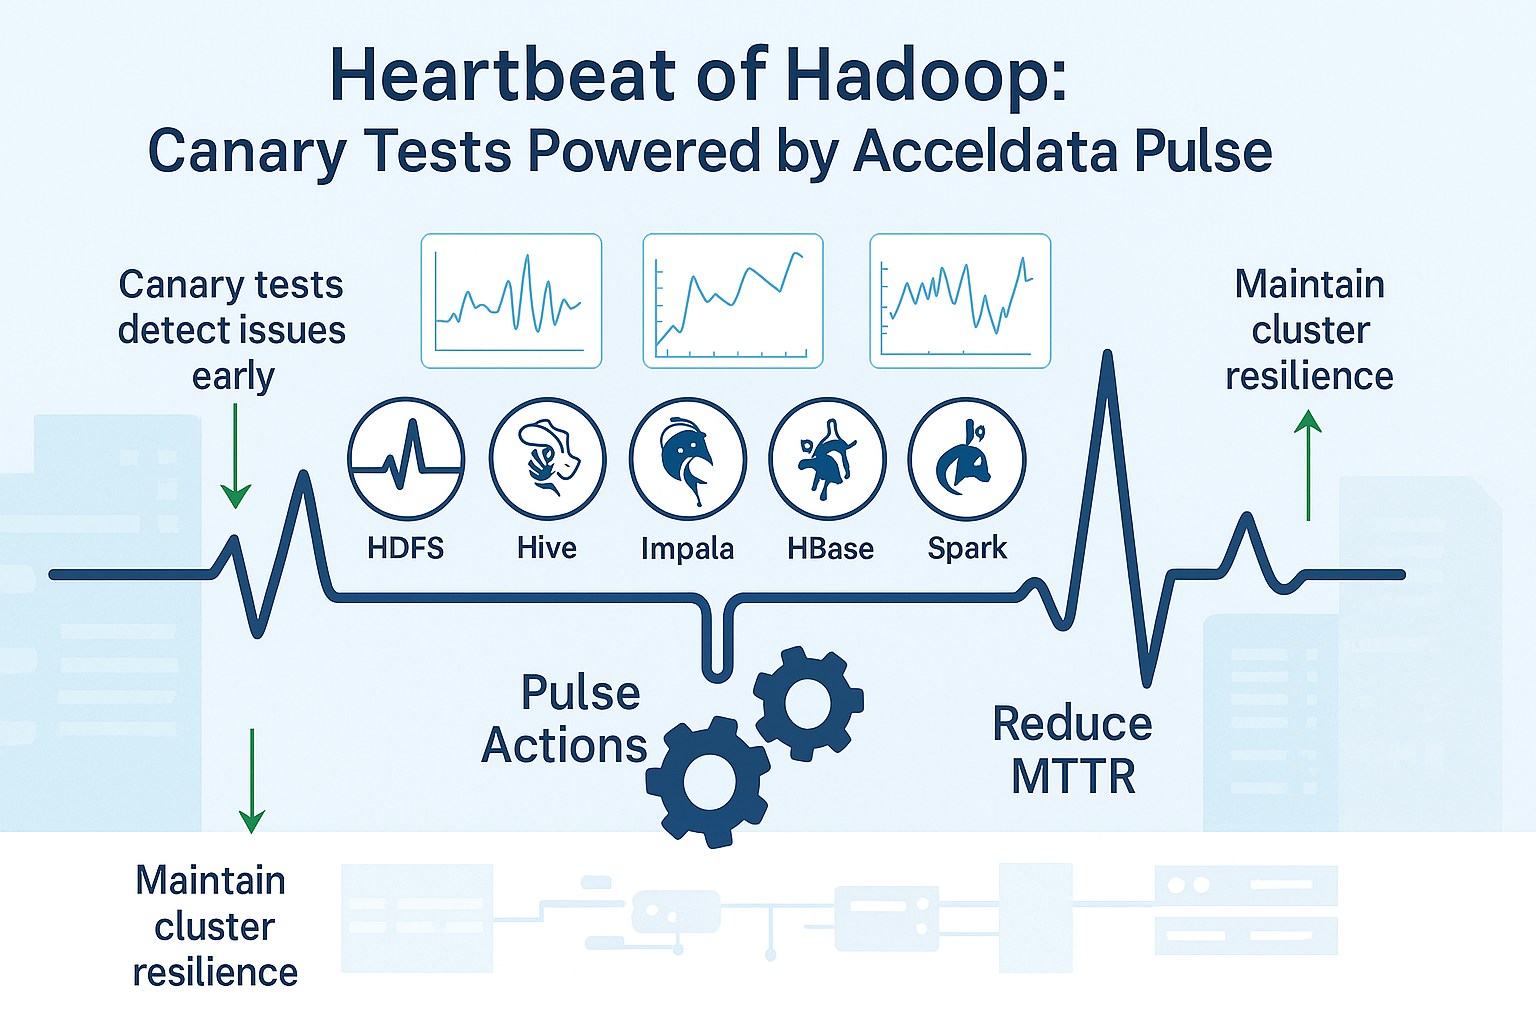
Imagine running a 200-node Hadoop cluster powering critical analytics. Even a minor hidden glitch, like an HDFS permission issue or a slow Hive query, can cascade into major outages. To stay ahead of such issues, Hadoop platform teams are turning to canary tests: small, scheduled health-check jobs that proactively probe each service’s functionality.
This use-case explains how Acceldata Pulse enables canary checks across Hadoop services, why they matter for reliability, and how they are implemented and visualized to boost uptime.
Purpose: Why Canary Checks Matter in Large Hadoop Stacks
In a large Hadoop stack, even minor performance regressions or component failures can cascade into major outages. Canary checks act as early-warning sensors – small, scheduled test jobs that continually probe the health and performance of critical services.
By running lightweight operations (for example, a quick HDFS file write or a simple Hive query) at regular intervals, administrators can detect anomalies before they impact business workflows.
This proactive approach is crucial for reliability: instead of waiting for user jobs to fail or SLA breaches to occur, canary tests surface degrading performance or emerging errors early.
In practice, Acceldata Pulse leverages this strategy to help teams “predict and resolve reliability or performance issues before they arise” By observing baseline metrics and spotting deviations, Pulse’s canary checks provide timely alerts when something starts to go wrong, allowing teams to fix issues while they are still small.
The result is higher confidence in the platform’s stability and fewer firefights in production.
Beyond outage prevention, canary tests also safeguard performance. In complex Hadoop ecosystems (HDFS, YARN, Hive, Impala, HBase, Spark, etc.), any component’s slowdown can bottleneck the whole system.
Regular canary runs establish a performance baseline for each service. If a daily Hive query that normally takes 5 seconds suddenly takes 30, or an HDFS write latency doubles, the canary will flag it.
As Acceldata’s Hive canary runbook exemplifies, Pulse can “check the run time of selected queries every day” and trigger notifications if the runtime deviates beyond an acceptable threshold.
In essence, these checks function like a Hadoop stethoscope – continuously monitoring the cluster’s vital signs. They matter because they turn what could be surprise outages into predictive maintenance tasks, drastically reducing unplanned downtime and ensuring the Hadoop platform delivers consistent, reliable performance.
High-Level Flow: How Pulse Runs Canary Tests Across Services
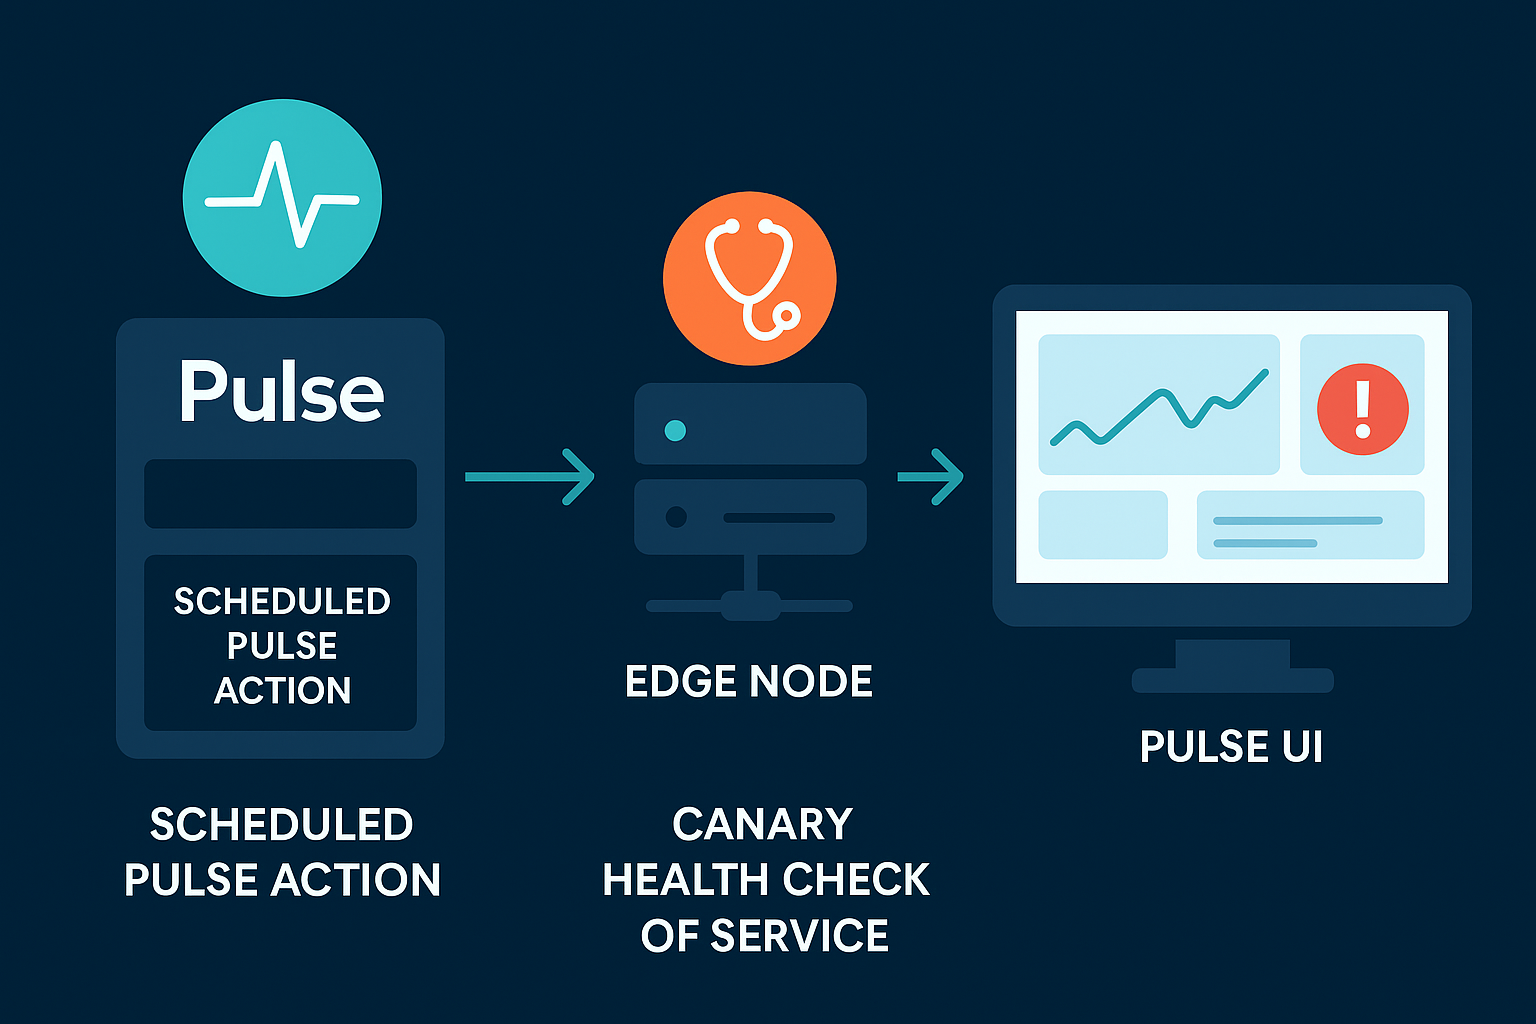
Acceldata Pulse provides a unified framework to schedule and execute canary tests across various Hadoop services. The high-level flow is as follows:
1. Scheduled Pulse Actions
Pulse allows administrators to define Actions (automated runbooks) and schedule them at desired intervals (hourly, daily, etc.) via a cron-like scheduler.
Each canary test is configured as a Pulse Action – for example, a Hive query canary or an HDFS read/write canary – with a specified schedule and target host(s). The scheduling is built-in, so canaries run reliably in the background without manual intervention.
2. Execution via Director
When the scheduled time arrives, Pulse’s Director microservice takes over. The Director triggers the defined action script and executes it on the target cluster node.
Under the hood, Pulse can use Ansible playbooks or lightweight agents to run commands on Hadoop nodes securely.
We need direct SSH access to each node – instead, a small agent on each node receives tasks from the Pulse server. This architecture ensures canary jobs run in a controlled manner across even tightly secured clusters.
3. Service-Specific Canary Scripts
The actual canary test logic is tailored to each service. Pulse comes with stock playbooks and canary scripts that exercise common Hadoop components. For instance, the Hive Canary Action will run a Hive SQL query (configurable by the user) and measure its execution time.
Similarly, a Canary Health Check action can be directed at services like Spark, Impala, etc by specifying the service name. This flexibility allows Pulse to trigger a Spark job, run an HDFS CLI operation, or invoke an HBase shell command as needed for the health check.
Each script is lightweight – designed to minimally impact the cluster while still verifying core functionality (for example, creating and deleting a tiny file on HDFS, or running a simple “SELECT 1” query on Hive/Impala).
4. Result Collection and Alerting
Once a canary action runs, Pulse captures its outcome (success/failure, execution time, etc.). If a canary test fails or if a performance metric deviates beyond a defined threshold, Pulse can immediately raise an alert/incident.
In our Hive canary example, Pulse compares the query’s runtime to a baseline; if it’s abnormally slow by a certain percentage, Pulse triggers notifications to the team.
This closed-loop design (test -> measure -> alert on anomaly) ensures that any budding issue in the Hadoop stack is brought to attention right away, often before end-users even notice.
The canary actions can also be linked to automated remediation – though in this context, they primarily serve to inform operators so they can investigate or failover the affected service.
At a high level, Acceldata Pulse orchestrates canary tests much like a “central nervous system” for the Hadoop platform: regularly pinging vital services and reacting if anything is amiss.
The combination of scheduled Actions, the Director/Agent execution model, and the integration with Pulse’s alerting system provides a robust, hands-free way to continually vet the health of Hadoop services across the board.
Prerequisites & Access: Setting Up the Canary Scripts
Setting up canary tests in Pulse requires a few prerequisites to ensure they run smoothly:
1. Cluster Access & Credentials
You’ll need valid access to the Hadoop cluster for Pulse to execute canary jobs. This typically means installing the Pulse agent on cluster nodes or providing SSH access.
Ensure the agent is deployed on all relevant nodes (e.g., HiveServer2 node for Hive canary, DataNodes for HDFS tests).
If not using an agent, you must provide a secure private key or credential for an authorized user to Pulse so it can run the playbooks remotely.
Only users with Admin roles in Pulse can create and configure these action scripts reflecting the need for elevated privileges.
2. Client Tools and Environment
The canary scripts will invoke service-specific commands, so the target host should have the necessary client binaries and permissions.
For example, a Hive canary query might run on an edge node that has Hive CLI or Beeline configured; an HDFS canary should run where hadoop fs commands can be executed (with Hadoop client configs in place); a Spark canary may require a node with Spark installed.
In Kerberos-secured clusters, make sure Pulse is aware of the Kerberos principal/keytab to use for these actions (Pulse allows specifying a Kerberos principal for the action, so the canary will authenticate properly).
Essentially, the environment for each canary should mimic a typical client of that service.
3. Configuration of Canary Parameters
When creating the canary Action in Pulse’s UI, you’ll input service-specific parameters.
For instance, for the Hive Canary Action you provide the Hive JDBC URL, a database name, and the test query to run. It’s wise to choose a lightweight query (e.g., selecting a count from a small table) and set a reasonable deviation threshold so that only significant slowdowns trigger alerts.
Likewise for other services: define what operation constitutes a “healthy” check (it could be a simple Impala SELECT, a small Spark PI calculation job, an HBase get/scan on a test table, etc.). Having these scripts or queries prepared and tested beforehand is important so that you know they are safe and quick to run in production.
With these prerequisites met – correct access, proper environment, and configured test actions – setting up the canary scripts in Pulse becomes a straightforward process. The result is a set of scheduled mini-workflows continually exercising your cluster’s key services.
Pulse Actions and Services Covered by Canary Tests
Acceldata Pulse canary tests cover a wide range of Hadoop services, effectively providing a full-stack health check. Key services and how they are tested include:
1. HDFS Canary
Verifies the Hadoop Distributed File System is functioning. Pulse can perform an HDFS health canary similar to Cloudera’s built-in HDFS canary – for example, creating and reading a small file on HDFS to ensure the NameNode and DataNodes respond correctly. This catches issues like write failures, permission or replication problems early on.
2. YARN/MapReduce (TeraSort Job)
To test the cluster’s compute layer and scheduler, Pulse can run a small TeraSort or similar MapReduce job as a canary. The TeraSort benchmark is a well-known Hadoop test that exercises both MapReduce and HDFS by sorting a dataset.
By scheduling a mini TeraSort (sorting, say, a few hundred MB of data), Pulse ensures YARN can launch jobs, containers are allocated, and HDFS I/O throughput is normal.
This can reveal issues in the data processing pipeline (like node manager failures or degraded disk performance) that wouldn’t be evident from service logs alone.
Even a quick job that finishes in a minute can serve as a robust end-to-end test of the cluster’s data flow.
3. Hive & Impala Queries
Pulse provides canary actions for SQL engines like Hive (and by extension Impala). The Hive Canary Action runs a specified Hive query periodically and measures its execution time.
A similar approach can be used for Impala – e.g., executing a lightweight SELECT query through the Impala shell or JDBC and verifying it returns results in the expected time.
These checks validate that the query engines are up and the underlying metastore and execution engines (Hive or Impala daemons) are performing.
If, for instance, the HiveServer2 is down or the query hangs due to a locked table, the canary will fail and signal an issue. Pulse’s canary queries are especially useful to catch regressions in query performance after changes in data or config.
4. Spark Jobs
For Apache Spark, administrators can configure a canary Spark application (such as a Spark PI calculation or a simple DataFrame operation) to run via Pulse.
Using the generic Canary Health Check action, you specify the Spark service name. allowing Pulse to invoke a Spark-submit or spark-shell command.
This ensures the Spark driver can start and that the Spark cluster (either YARN-managed or standalone) can allocate executors to run a job.
If Spark’s resources are exhausted or there are configuration issues, the canary job will surface that. It’s a quick barometer for your big data processing capability beyond MapReduce.
- HBase Canary: HBase canaries monitor the NoSQL store’s health. HBase itself comes with a canary tool, and Pulse can leverage that by running an HBase canary action or a small get/put on a test table.
This check confirms that RegionServers are responsive and that data can be read/written. If a RegionServer is down or a table is in a disabled state unexpectedly, the canary will detect the failure.
By scheduling it regularly, you avoid discovering HBase issues only when an application times out; instead the ops team is alerted proactively. - Other Services: Pulse’s canary framework is extensible. Essentially, any service that can be tested via command-line can be turned into a Pulse canary Action, making the coverage as broad as your ecosystem demands.
By deploying these canary tests across HDFS, Yarn/MapReduce, Hive, Impala, Spark, HBase, and more, Pulse gives a holistic picture of cluster health.
Each service’s canary acts like a specialist sentry for that component, and together they ensure no part of the stack suffers in silence.
🧰 Pulse Canary Test Flow (High-Level)
Pulse’s canary framework is that every test can be customized to reflect your specific platform setup and operational priorities. You’re not limited to pre-packaged checks.
Metric Emission & Visualization: From VictoriaDB to Dashboards
When Pulse runs canary tests, it doesn’t just throw an alert on failure – it also records detailed metrics from each run. The results (timings, statuses, and other telemetry) are emitted into Pulse’s observability data pipeline and stored in a time-series database (VictoriaMetrics, referred to internally as VictoriaDB).
Every canary execution produces data points – for instance, the Hive query canary might log the query duration (in seconds) and a success/failure flag. These metrics accumulate over time, building a historical record of service performance under the canary tests.
Acceldata’s Dashplot dashboards then bring these metrics to life. Dashplot is a visualization tool within Pulse that lets you create custom charts and dashboards from backend data.
Through the Dashplot interface, you can query the VictoriaDB time-series data and plot it in various chart types (line graphs, bar charts, daily moving averages, etc.) For example, you might set up a dashboard showing a time-series of the HDFS canary write/read latency over the past week.
By applying a moving average on this chart, you smooth out minor fluctuations and can clearly see trends – is HDFS gradually slowing down day by day? Did the Hive query performance improve after last week’s configuration tweak? Such insights are immediately visible on the graphs.
The metrics flow looks like this: Pulse Action → VictoriaDB (time-series storage) → Dashplot Visualization. Users can build dashboards combining multiple canary metrics, giving a comprehensive health overview.
One dashboard could show all services at a glance: HDFS canary latency, Hive canary query time, Impala canary result time, Spark job duration, etc.
If any metric deviates significantly, it might be highlighted via Pulse’s anomaly detection or simply show up as a spike on the chart. Since Dashplots update in real-time (and can be auto-refreshed), the operations team effectively gets a live heartbeat of the cluster’s critical paths.
Crucially, these visualizations aid in trend analysis and troubleshooting. By examining time-series and applying moving averages or comparisons, you can differentiate between one-off anomalies and persistent degradation.
For instance, a single spike in Hive query time might be a transient hiccup, whereas a steady upward trend over several days indicates a developing problem (like metadata bloat or resource contention).
With Pulse’s metrics in VictoriaDB and Dashplot’s ability to slice and dice the data, Hadoop admins and engineers gain a powerful lens to verify that the system is healthy now and to forecast future issues before they become incidents.
Operational Value: Improving Reliability and Reducing MTTR with Canaries
The introduction of automated canary tests via Acceldata Pulse yields significant operational benefits for Hadoop environments.
First and foremost, it improves reliability by ensuring that incipient problems are caught early. Instead of waiting for an end-user to report that “HBase is down” or a pipeline to fail overnight, the platform team gets proactive alerts from canaries (often hours or days sooner than a user would notice).
This proactive stance means many issues can be resolved during normal business hours, in a controlled manner, rather than during a firefight at 2 AM.
Early detection directly translates to a lower Mean Time to Repair (MTTR). Because Pulse’s canaries shorten the Mean Time to Detect (MTTD) problem, the team can start the remediation sooner, shaving down the total outage duration.
In practice, organizations see MTTR improvements as the ops team is notified of anomalies within minutes.
For example, if the Hive canary query fails at 3 PM, engineers can investigate immediately and perhaps restart HiveServer2 or fix the underlying cause by 3:30 PM, well before any nightly ETL jobs begin – avoiding a potential major incident.
Without the canary, that Hive issue might only be discovered the next morning when reports are wrong, extending the outage impact. As one industry example highlights, having monitoring that detects issues proactively is key to minimizing downtime.
Canary tests also bolster confidence and stability during changes. When rolling out a Hadoop upgrade or configuration change, the team can rely on the canaries to quickly validate that all services still function.
If a new version of Spark is deployed, the Spark canary job’s success reassures the team that core functionality is intact (or flags any regression immediately).
This reduces the risk of migrations or updates, as issues are caught by the automated “smoke tests” rather than by end-users or critical workloads. Pulse’s scheduled tests essentially act as a continuously running regression suite for the data platform.
Another operational gain is the ability to perform capacity planning and performance tuning with data from canaries.
Over time, the metrics collected (and visualized via Dashplots) reveal patterns – perhaps Hive query canary times are creeping up as data grows, suggesting it’s time to add more LLAP nodes or optimize queries. By spotting these trends, teams can take action before performance hits a tipping point.
Finally, the synergy of Pulse’s canaries with its alerting and incident management means any failure triggers immediate, context-rich notifications (with the specific service and test that failed).
Integrations with Slack, email, or PagerDuty ensure the right people know right away. Some teams even tie Pulse canary alerts into automated incident tickets (JIRA, etc.) to streamline response. All of this reduces the overhead and reaction time when dealing with Hadoop issues.
In summary, implementing canary tests across Hadoop services with Acceldata Pulse transforms the platform team’s approach from reactive to proactive. The system becomes more self-assuring – continuously validating its own health.
This leads to higher uptime, fewer firefights, and faster recovery from the issues that do occur.
In the high-stakes world of big data (where downtime can mean missed SLAs and lost insight), such improvements in reliability and MTTR are game-changers for Hadoop administrators and architects, enabling them to deliver a more robust and trustworthy data platform for your organizations.
Make your Hadoop cluster work harder, not costlier! See how its done


