


.svg)


.webp)
.png)
Snowflake offers elasticity, scalability, and ease of use—but data reliability isn’t built-in. In large organizations, one broken pipeline or unnoticed schema change can disrupt analytics, trigger compliance risks, and erode trust in the data team.
ADOC’s Data Reliability module fills this critical gap by detecting silent data failures, schema drift, stale tables, outliers, duplicates, and more—before they impact decision-making. With real-time alerts, automated lineage, and historical intelligence, ADOC shifts teams from reactive firefighting to proactive prevention.
Modern data stacks are evolving rapidly — from ingestion to transformation to consumption, businesses expect fast, accurate, and reliable data pipelines. But while tools like Snowflake and DBT Cloud handle transformation and warehousing well, ensuring the reliability and observability of these pipelines is still a challenge.
In this blog, I’ll walk through a real-world integration of:
using the open-source jaffle_shop_snowflake project as the backbone for demonstration.
What Is This Project About?
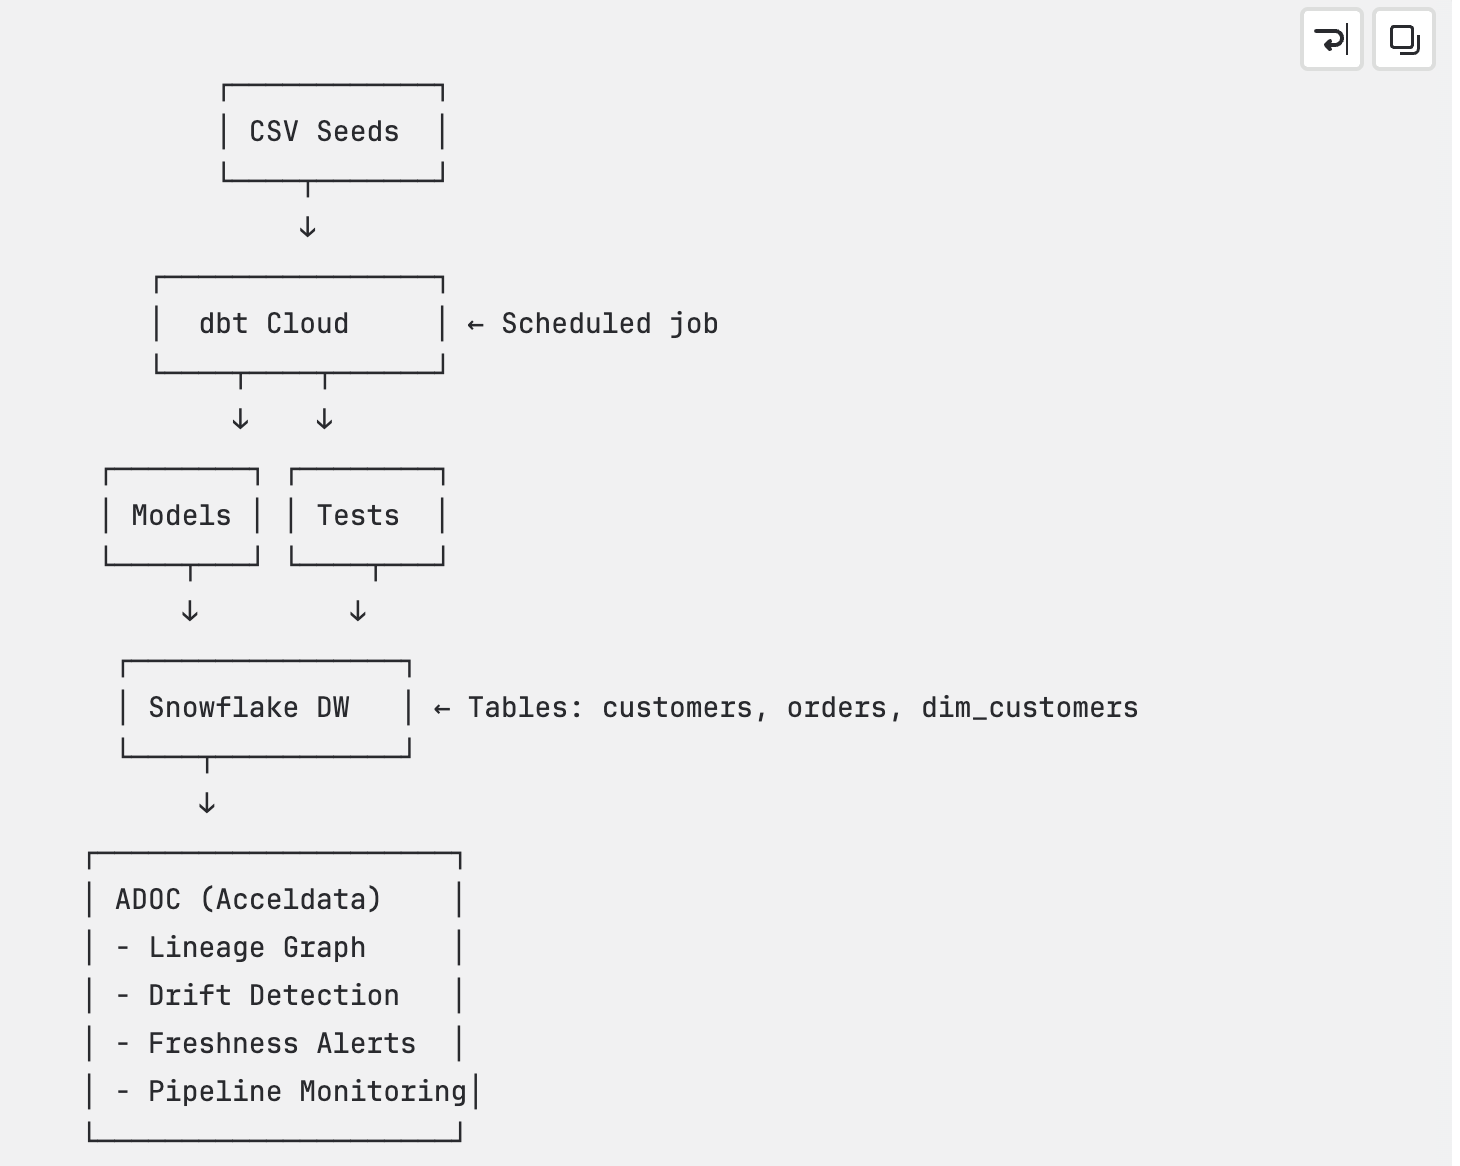
The jaffle_shop_snowflake project is a simple but powerful example of DBT workflows:
- It uses raw tables like raw_customers, raw_orders, and raw_payments
- These are transformed into staging and mart tables, such as stg_orders, stg_customers, customer_orders, etc.
- DBT jobs orchestrate these transformations using SQL models, tests, and documentation.
- Everything runs inside Snowflake, with scheduling handled by DBT Cloud jobs
👉 Think of it as a simplified production data pipeline for an e-commerce platform.
Why Do We Need Observability?
Here’s the problem:
DBT and Snowflake can run jobs and transformations, but they do not monitor or alert you when things go wrong behind the scenes.
What happens when:
- A schema changes in Snowflake?
- A transformation silently fails or runs with incorrect data?
- A table that updates daily suddenly doesn't?
These kinds of data reliability issues are hard to catch — unless you add an observability layer.
That’s where Acceldata ADOC Pipelines come in.
Introducing Acceldata ADOC
Acceldata ADOC (Acceldata Data Observability Cloud) is a platform built for end-to-end data observability. It monitors your data pipelines in real time, helps detect anomalies, and ensures your data assets are reliable.
When integrated with DBT Cloud and Snowflake, ADOC provides:
- Real-time alerts on data issues
- Schema drift detection
- Freshness and SLA monitoring
- Column-level lineage
- Pipeline execution visibility
- Data profiling and anomaly detection
Integration Flow: DBT → Snowflake → ADOC
Here’s how the full flow looks:
- Define Models as Code in GitHub
Your DBT project is version-controlled in a GitHub repository. This includes all models, sources, macros, and configurations written as SQL and YAML. This "models-as-code" approach ensures transparency, auditability, and collaboration in your data transformation logic. - Connect Snowflake as a Data Source in DBT Cloud
Within DBT Cloud, you configure a connection to your Snowflake data warehouse. This enables DBT to execute transformation logic against Snowflake tables, views, and schemas. - Configure DBT Cloud as a Data Source in ADOC
In the ADOC platform, you add DBT Cloud as a data source (via the DataDoc connector). This allows ADOC to ingest metadata, execution context, and lineage information directly from DBT Cloud jobs. - ADOC Tracks Pipeline Executions and Enhances Observability
Once integrated, ADOC automatically starts monitoring all DBT pipeline executions. It performs the following actions:- Data Profiling: Examines the structure, null values, outliers, and distributions of data outputs from your DBT models.
- Schema Drift Detection: Alerts when changes occur in your Snowflake schema that deviate from what's defined in your DBT models (e.g., dropped or altered columns).
- Execution Monitoring: Tracks job statuses, run durations, failures, and anomalies in real time.
Central Pipeline Monitoring with ADOC UI
Once DBT Cloud is integrated with ADOC, each DBT job execution is automatically captured and displayed as a pipeline run within the ADOC UI.
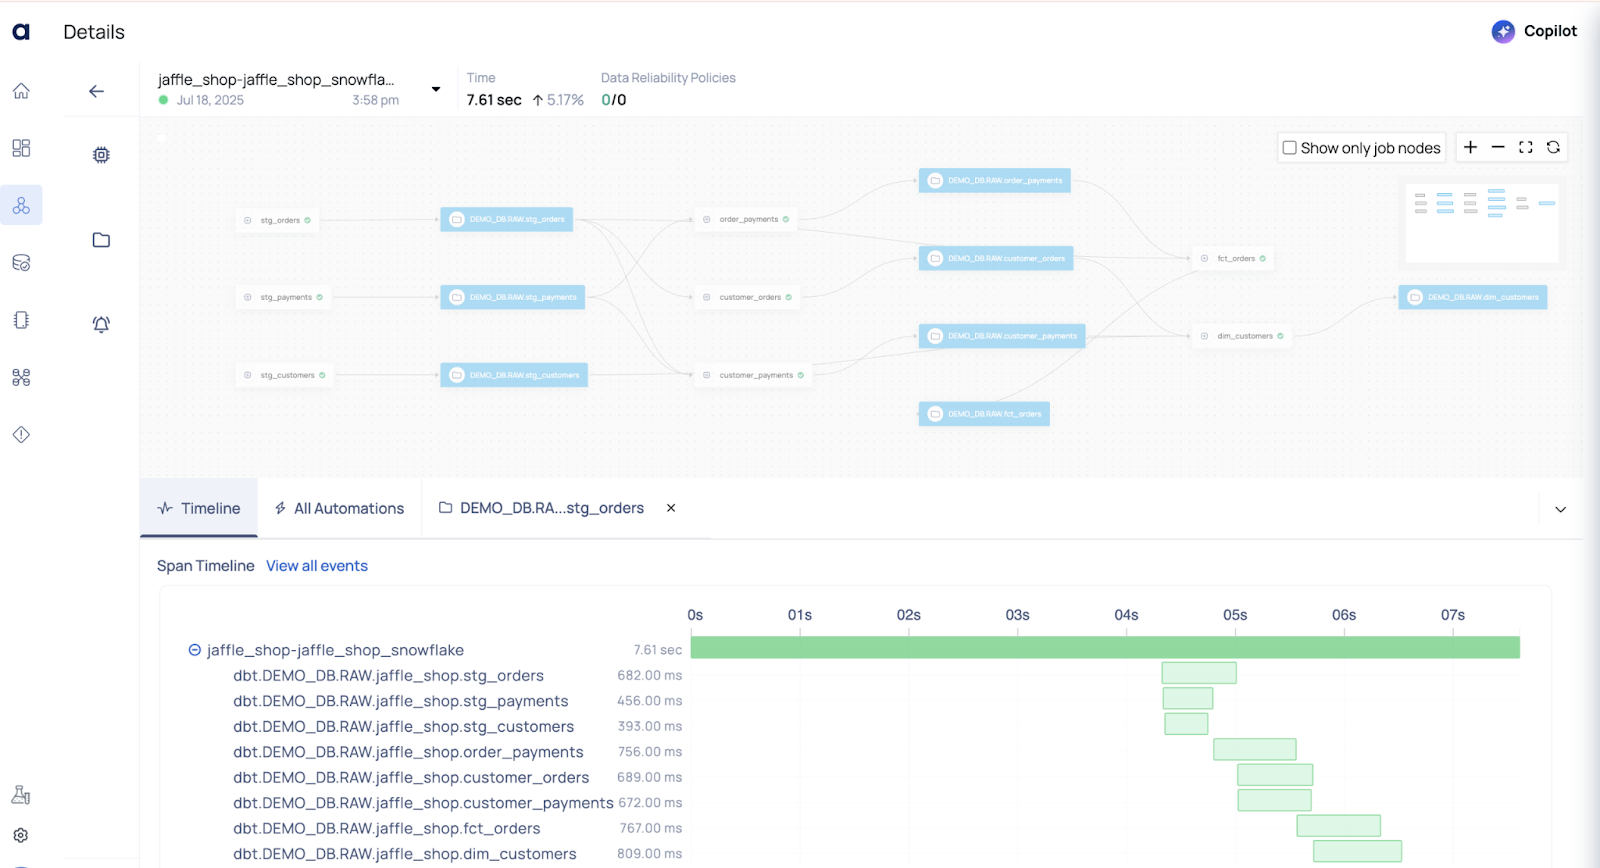
This gives you a centralized, real-time view of your data transformation workflows and their health across your Snowflake environment.
From the ADOC UI, you can easily inspect:
- Execution Duration – Track how long each job took and identify slow or failed runs.
- Linked Models and Tables – View which DBT models were materialized and which Snowflake tables were impacted.
- Profiling Statistics – Analyze row counts, null distributions, data types, and outliers post-execution.
- Schema Versions – Detect changes or drift in schema (added/dropped/modified columns) over time.
- Data Lineage – Visualize both upstream and downstream dependencies for complete impact analysis.
💡 With this integration, ADOC becomes your single pane of glass for monitoring data health, reliability, and changes across your DBT + Snowflake pipeline.
Detailed Example: How ADOC Helps in Real Scenarios
Let’s break down a few scenarios that are common in real data teams, and how ADOC helps mitigate them.
Scenario 1: Unexpected Data Volume Drop
Context:
Your raw_orders table typically receives around 10,000 rows daily. One day, it only receives 5 rows — yet the pipeline still runs, and dashboards reflect this incomplete data, leading to misleading results.
Why This Matters:
Without early detection or visibility, your team only becomes aware after stakeholders report issues, resulting in:
- Loss of trust in the data
- Delayed response and resolution
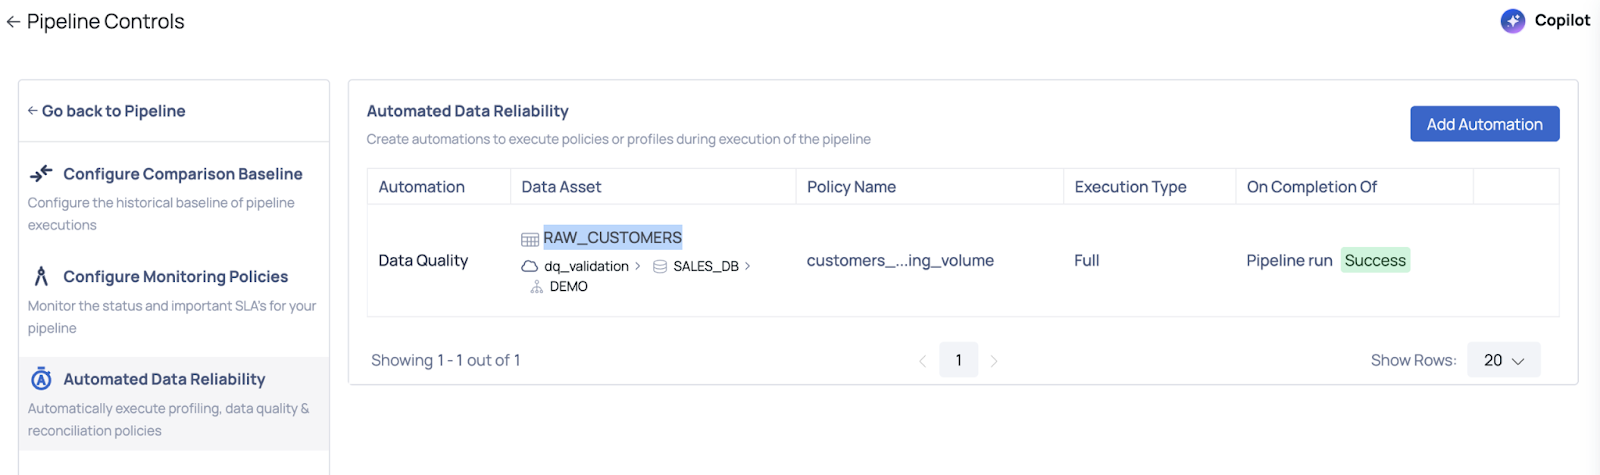
With ADOC: Automate Data Reliability in the Pipeline
How ADOC Helps:
Instead of reacting to problems after they surface, ADOC enables proactive data reliability as a built-in part of your pipeline.
In the case of a volume drop (e.g., in RAW_CUSTOMERS), ADOC can:
- Automatically detect the anomaly using built-in data checks
- Trigger real-time alerts to notify the right team members
- Prevent downstream impact by flagging or halting the pipeline early
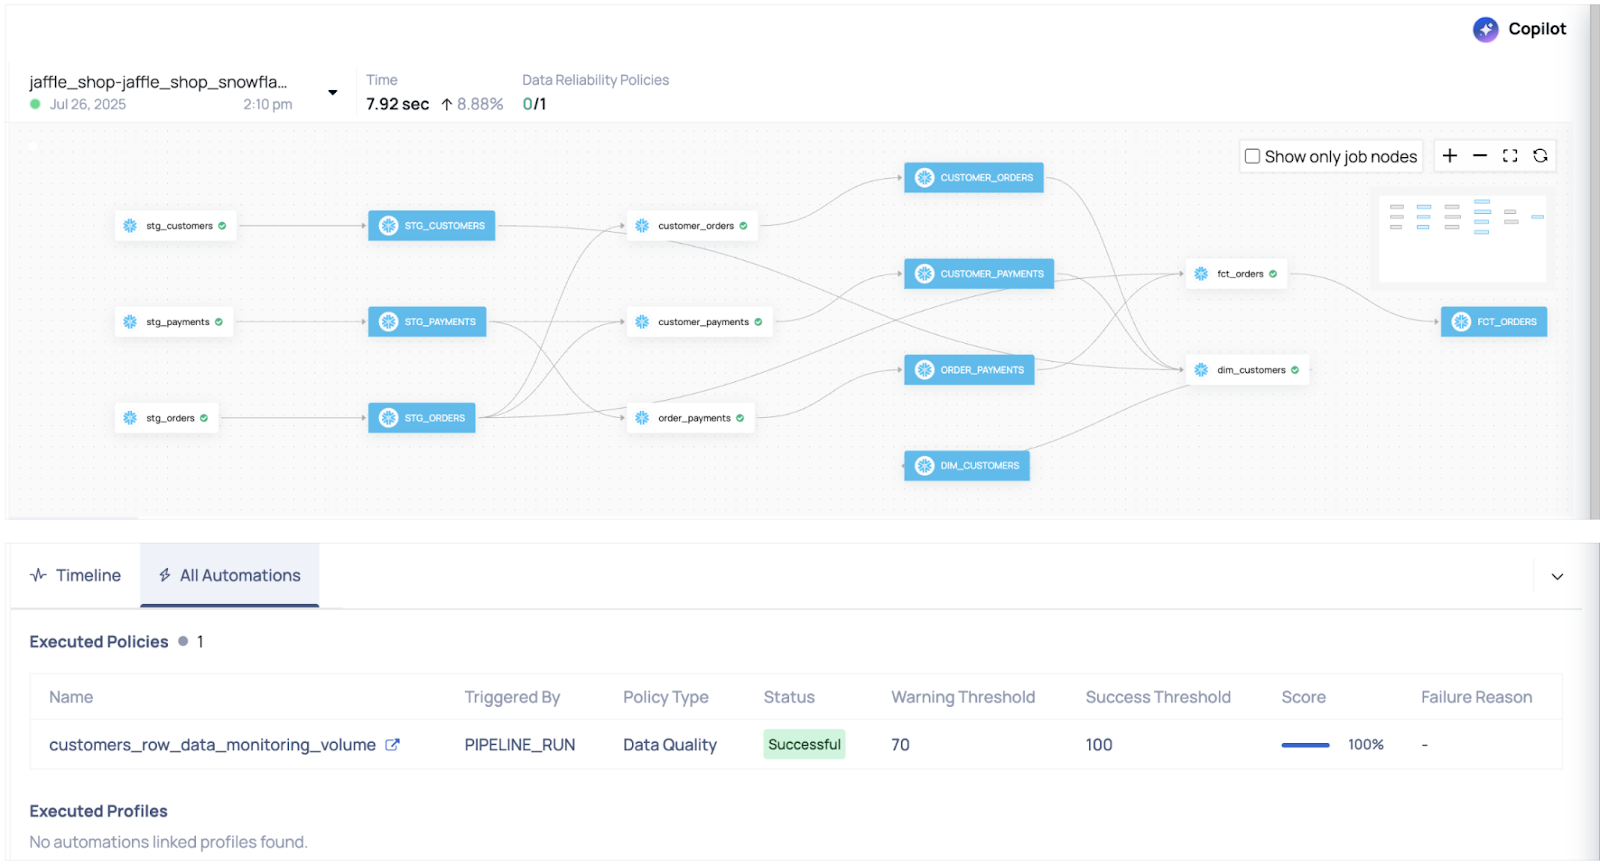
Key Benefit: Proactive Anomaly Detection
With ADOC, anomaly detection becomes an active, automated step in your data pipeline — not just something you discover after the damage is done.
Scenario 2: Schema Drift in raw_payments
Let’s say a developer drops a column from raw_payments (payment_method) or changes its data type.
- DBT might not catch this if no test is defined.
- The job may run and produce incorrect output silently.
With ADOC:
- ADOC automatically compares current table schema with historical versions.
- When a drift is detected (e.g., column removed, renamed, or type changed), it:
- Logs a schema drift incident
- Sends real-time alerts to Slack, email, or webhooks
- Annotates this incident in the pipeline timeline in the UI
This allows teams to stop bad data before it spreads to dashboards or reports.
✅ Final Thoughts
While DBT and Snowflake provide a powerful foundation for modern data pipelines, they don’t guarantee reliability.
ADOC adds the missing observability layer—giving you:
- Early warning systems
- Deep pipeline visibility
- Trustworthy data products
If your team is scaling its data infrastructure or moving toward data productization, this integration is a must-have for maintaining reliability and trust.
Keep your data pipelines reliable—book your demo now and see ADOC in action.


