


.svg)


Introduction: Hive evolution
Apache Hive was originally developed at Facebook to bring SQL-like querying capabilities to Hadoop’s batch processing framework. At its core, Hive translated SQL queries into MapReduce jobs—an innovation at the time that made big data accessible to analysts without needing to write complex Java code. However, this approach came with a significant trade-off: high query latency and limited optimization flexibility.
To overcome these limitations, the Hive community began innovating on the execution engine side. The key milestones in Hive’s evolution include:
- Hive on MapReduce (Classic Hive): Reliable but slow, with poor performance for interactive or ad hoc queries.
- Hive on Tez: Introduced as part of Hive 0.13+, Apache Tez replaced MapReduce by offering a DAG-based execution engine, enabling faster, more flexible query plans with reduced I/O overhead.
- LLAP (Live Long and Process): Introduced to support sub-second queries by keeping data in-memory and reusing daemons across queries.
Understanding Hive query flow
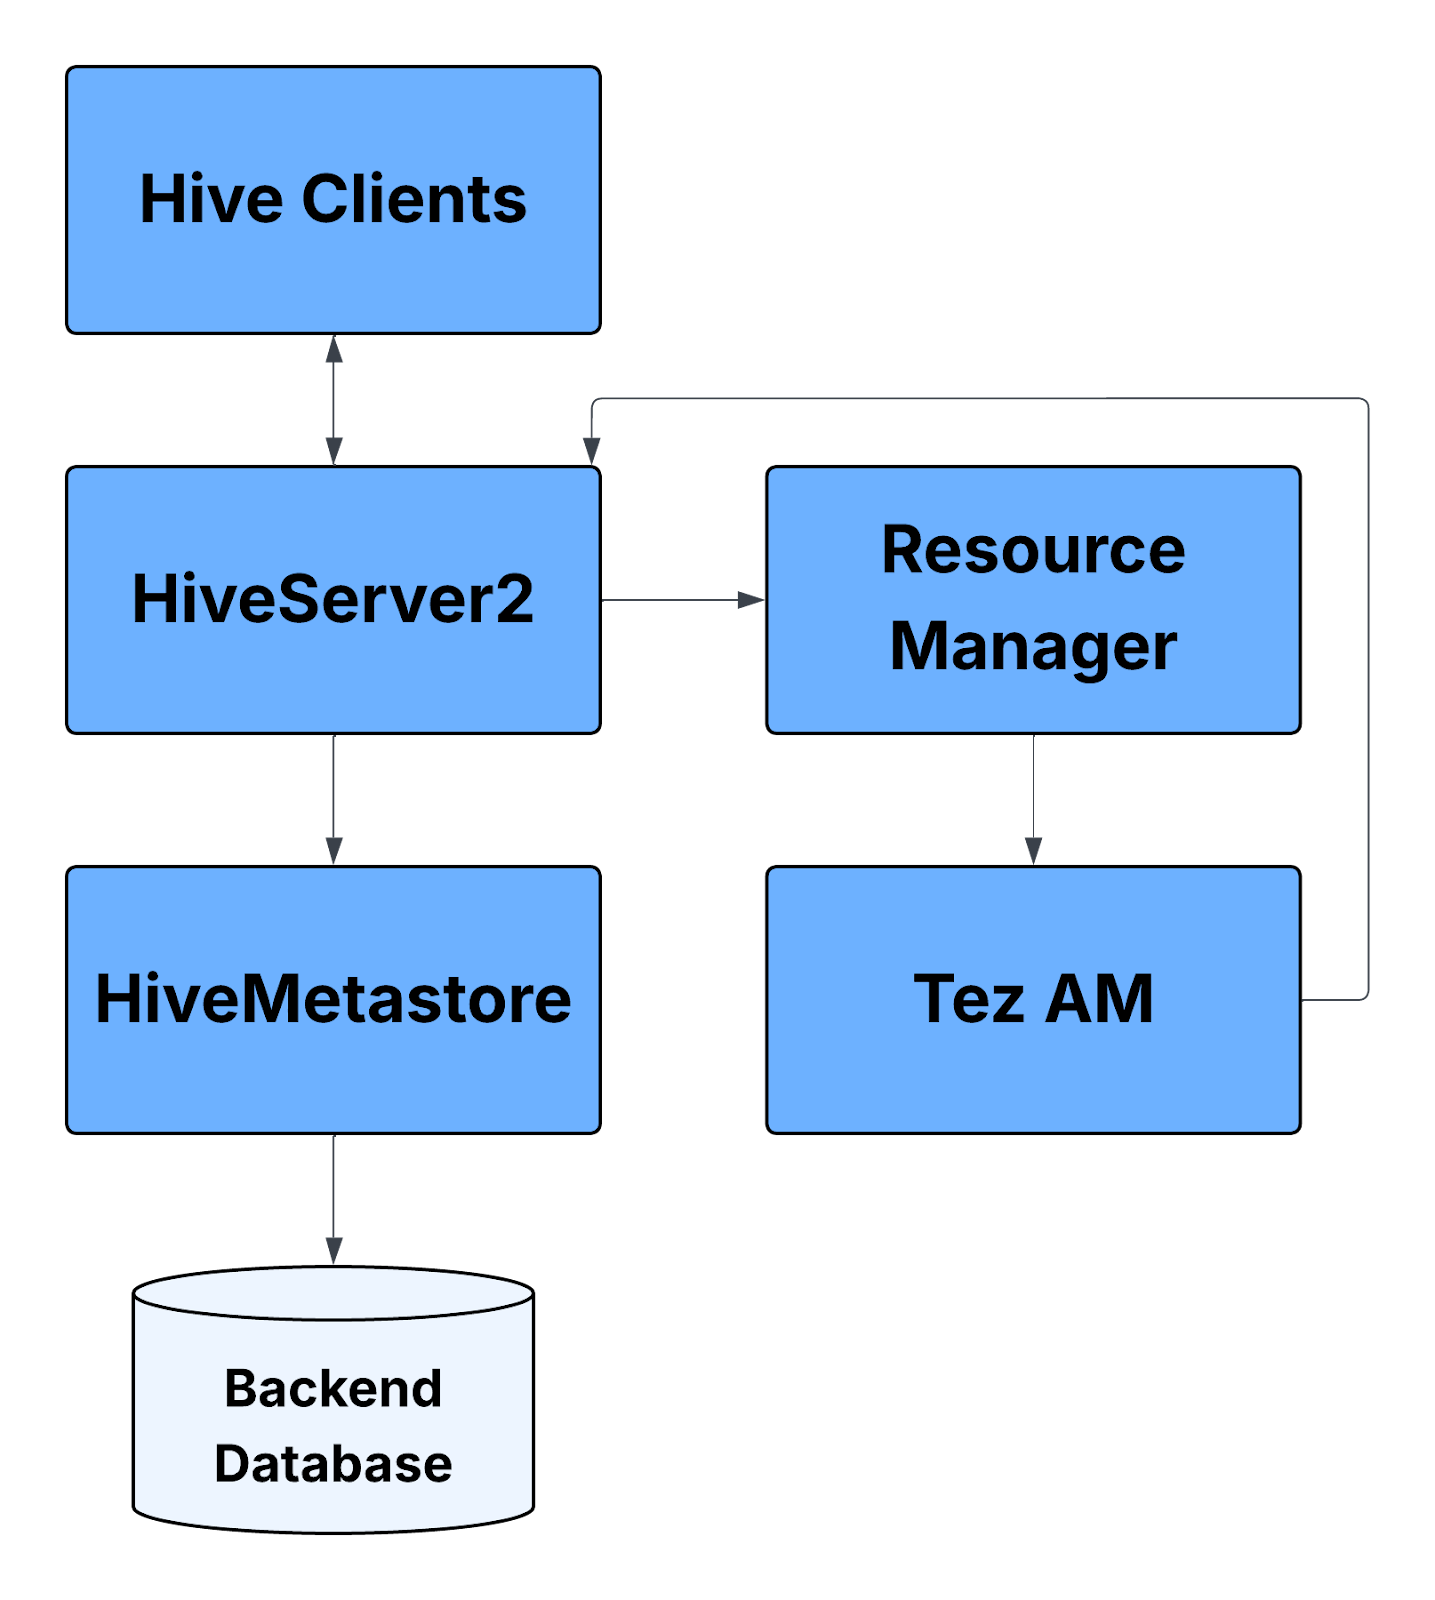
Hive Query Flow using various Hadoop Services: Simplified
From the Service architecture side, there are various services on Hive, Yarn and HDFS involved when running a Hive query using Tez.
- Hive query is submitted via Hive clients. These are the interfaces used to submit queries such as Beeline (via JDBC), ODBC Clients, Web UIs, Hive CLI (deprecated in newer versions),they connect to HiveServer2 to run HiveQL queries.
- HiveServer2 is the primary entry point for client connections and provides Query compilation, Authentication/Authorization services, Session management etc. It also communicates with Hive Metastore (to fetch metadata) and YARN (to launch execution engines like Tez).
- The Hive Metastore is a critical component that is responsible for metadata about databases, tables, partitions, columns, etc. It provides APIs (Thrift-based) for metadata access. Internally it connects to a Backend Database (like MySQL/PostgreSQL/Oracle) where the metadata is persisted.
- HS2 submits the execution plan to YARN, which manages resources for execution. YARN ResourceManager: Allocates containers specifically, Tez ApplicationMaster (AM): Launched in a container, coordinates DAG execution.
Hive Query Flow on Tez: Simplified
When Hive uses Tez as its execution engine, the query flow follows a more modern and optimized path:
- Parsing & Semantic Analysis: The Hive query is parsed, and a logical plan is generated.
- Optimization & Compilation: The logical plan is optimized and translated into a Tez Directed Acyclic Graph (DAG), where each vertex represents a stage of the query (e.g., scan, join, group by).
- Job Submission: The Tez DAG is submitted to the YARN ResourceManager via the Application Master (AM).
- Execution: Tez manages container allocation, task execution, data shuffling, and retry logic—all with finer granularity than MapReduce.
- Result Handling: Results are either stored in HDFS or returned to the user via HiveServer2.
This transition to Tez brought dramatic improvements in performance and efficiency, but it also introduced new complexities in troubleshooting. Unlike MapReduce, Tez DAGs can be harder to interpret, especially when something fails or underperforms. Logs are scattered across multiple systems, and task-level metrics aren't always easy to correlate with high-level query issues.
This is where Acceldata Pulse steps in—providing end-to-end visibility, performance breakdowns, and smart diagnostics to simplify Hive-on-Tez query management.
Supercharge Hive Tez Query Troubleshooting with Acceldata Pulse
Apache Hive, when combined with the Tez execution engine, is a powerful platform for executing large-scale analytical workloads. But as query volumes and complexities increase, so do the challenges of diagnosing slow queries, skewed processing, misconfigured resources, and failed DAGs.
Enter Acceldata Pulse—a modern data observability platform that provides rich, actionable insights into your Hive-on-Tez workloads.
In this post, we'll explore how Acceldata Pulse empowers data engineers and platform teams to troubleshoot Hive queries faster, optimize performance, and gain complete visibility across the data stack.
Why Hive Query Troubleshooting is Hard
Troubleshooting Hive queries running on Tez can often feel like piecing together a puzzle from:
- HiveServer2 logs
- YARN ResourceManager UI
- File formats and metadata
- Metrics from HDFS, YARN, and the Metastore
Without a unified view, you're left correlating logs manually across disparate systems. This leads to:
- Slow root cause analysis
- Inconsistent developer experience
- Missed optimization opportunities
- Poor user SLAs for BI workloads
How Acceldata Pulse Helps in Hive/Tez Query Troubleshooting
Acceldata Pulse provides end-to-end observability for Hive queries by combining system, application, and platform-level metrics in one place.
Here are the key benefits of using Pulse for Hive-on-Tez troubleshooting:
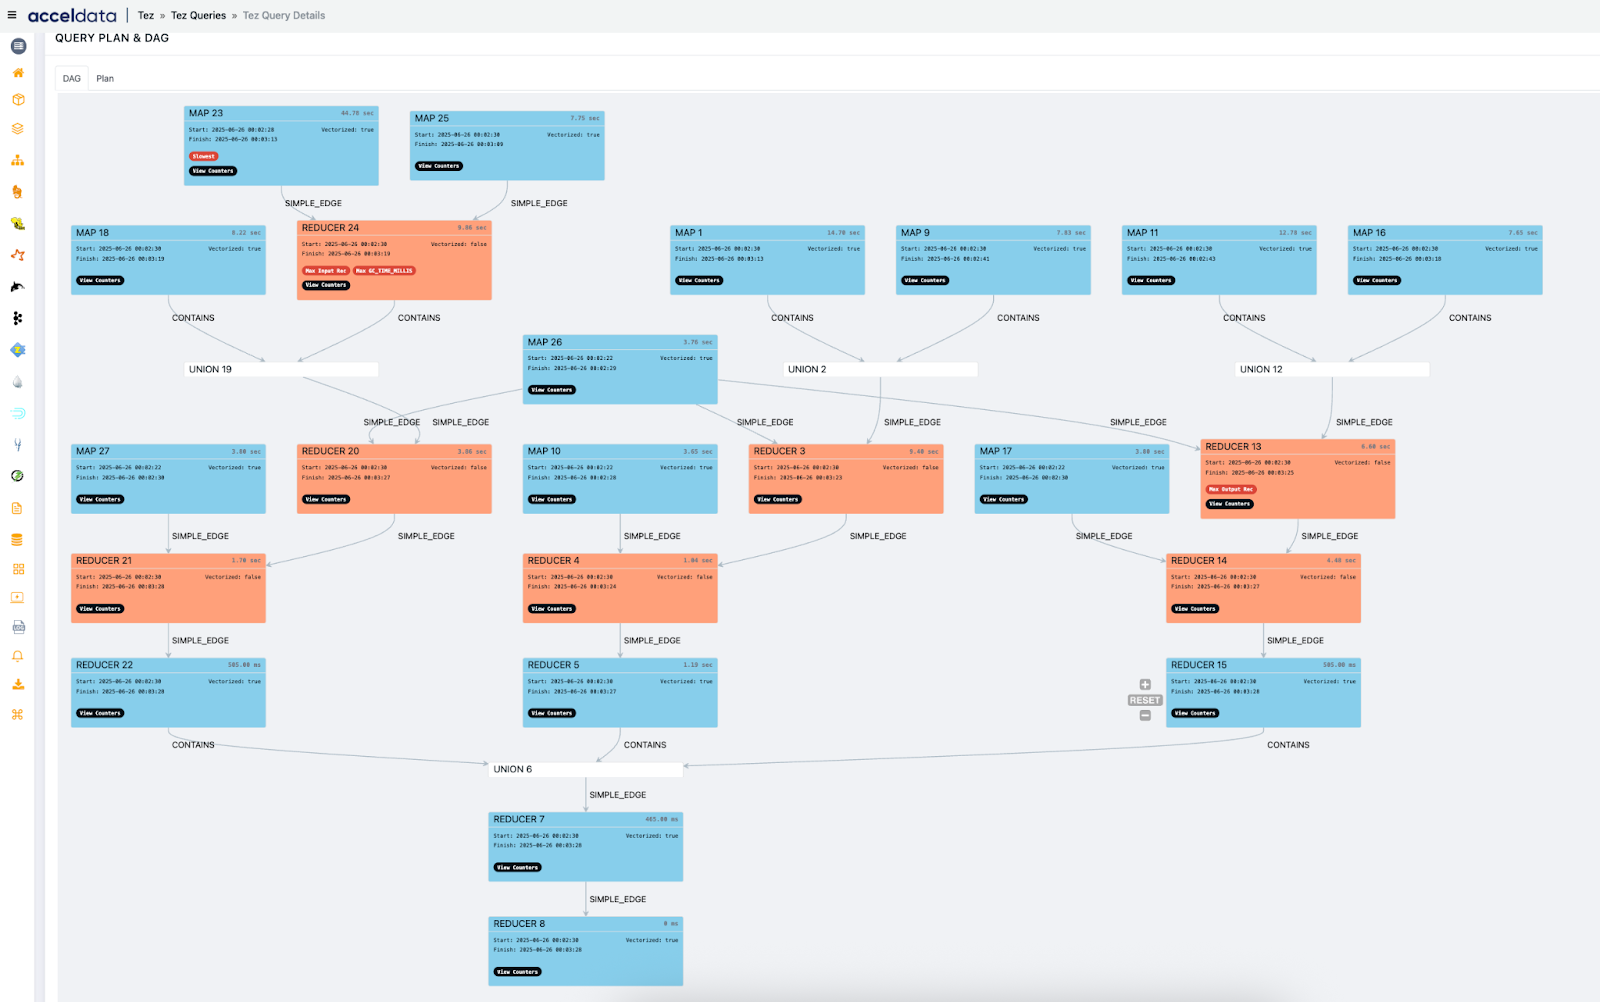
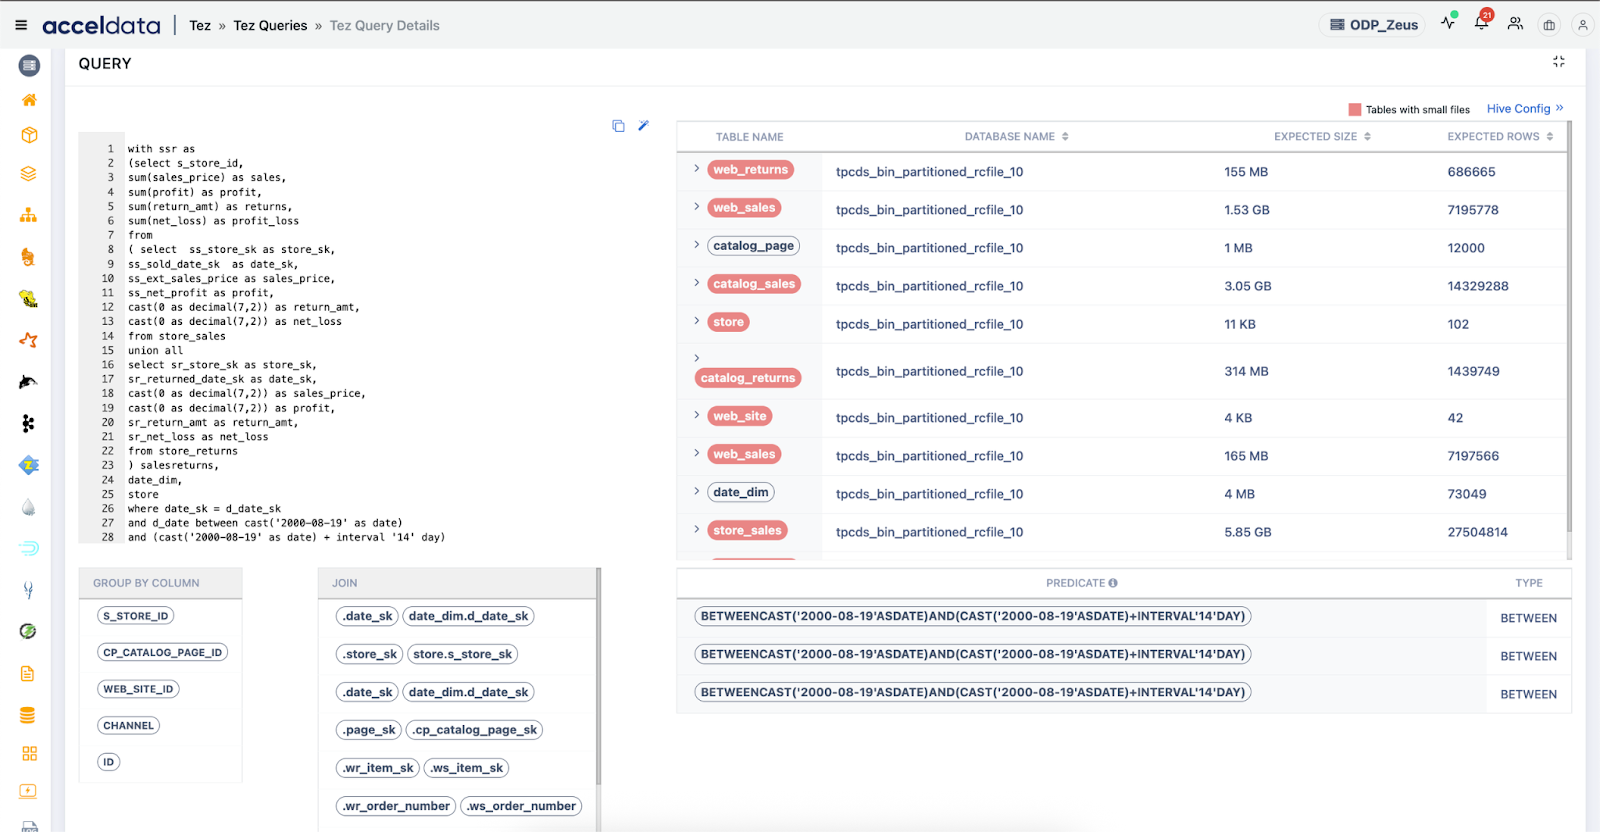
1. Query Lineage & DAG Visualization
Pulse provides a visual representation of how a Hive query translates into a Tez DAG, including:
- Each stage/vertex of the DAG
- Operators involved (scan, join, filter, group by, etc.)
- Task parallelism and execution time
- Errors or retries at the vertex level
Use Cases:
- Identify stage bottlenecks: Spot the exact vertex where execution slows, such as a skewed join or heavy sort.
- Understand query complexity: Visualize how many stages a query spans, helping optimize joins or aggregations.
- Correlate joins to Tez vertices: Understand which part of the DAG corresponds to broadcast vs. shuffle joins.
- Audit lineage: Trace how specific source tables and partitions contributed to output, aiding compliance and debugging.
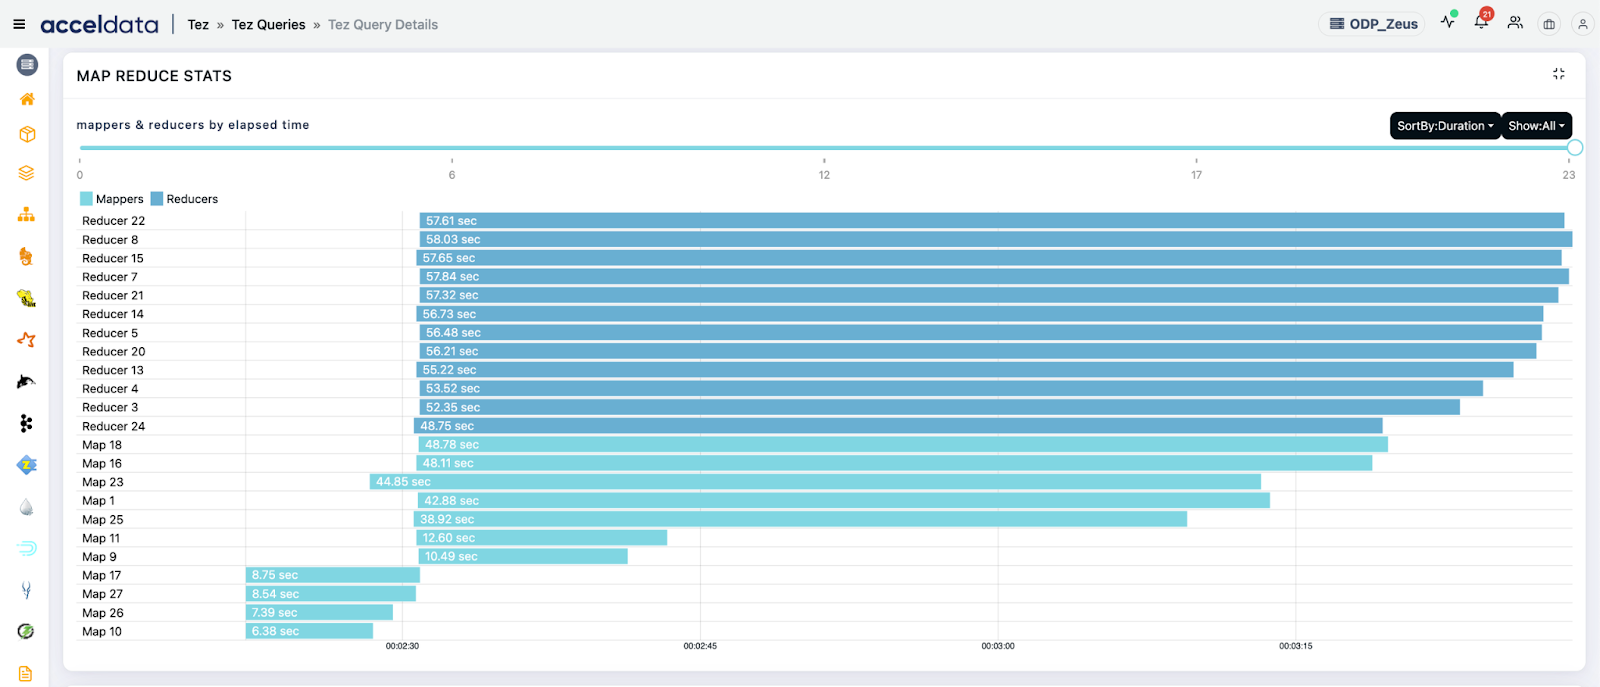
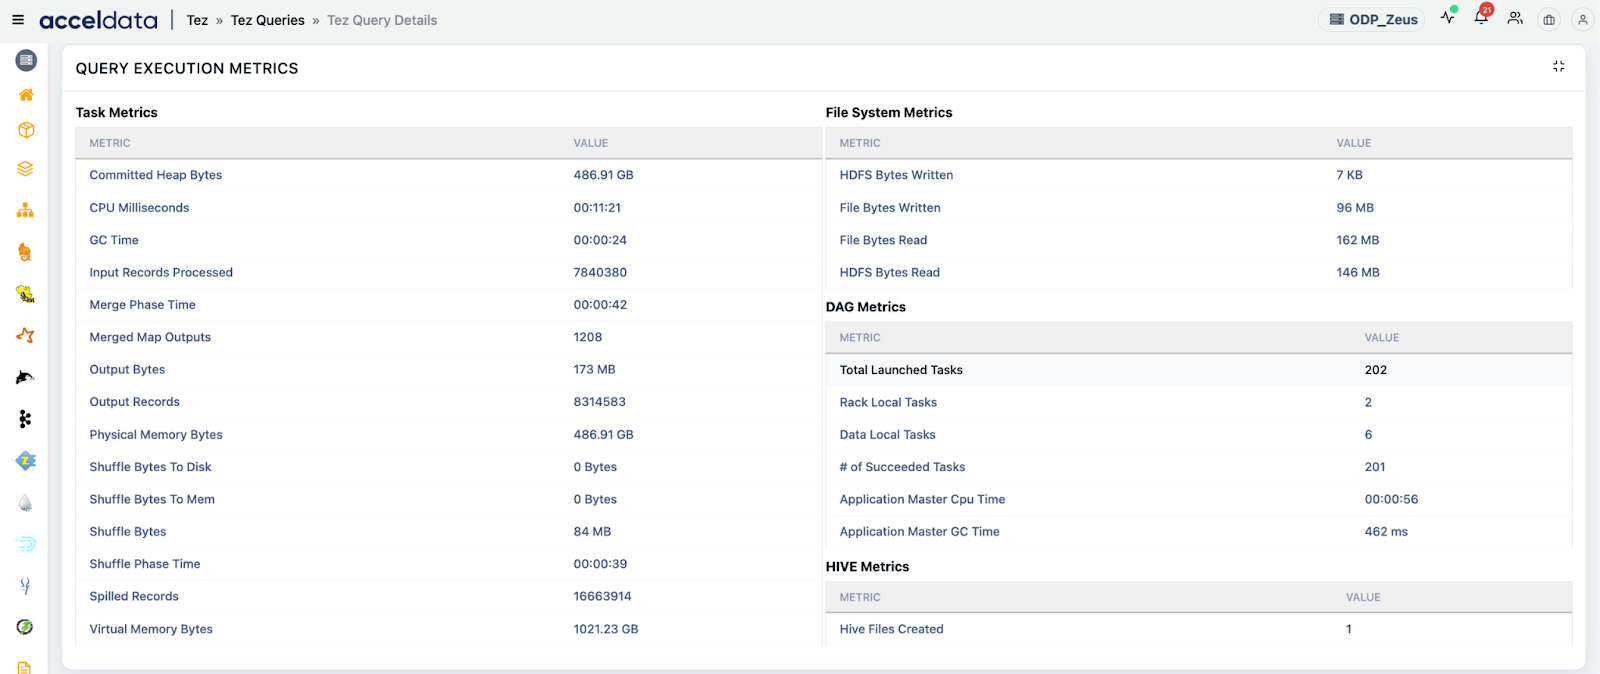
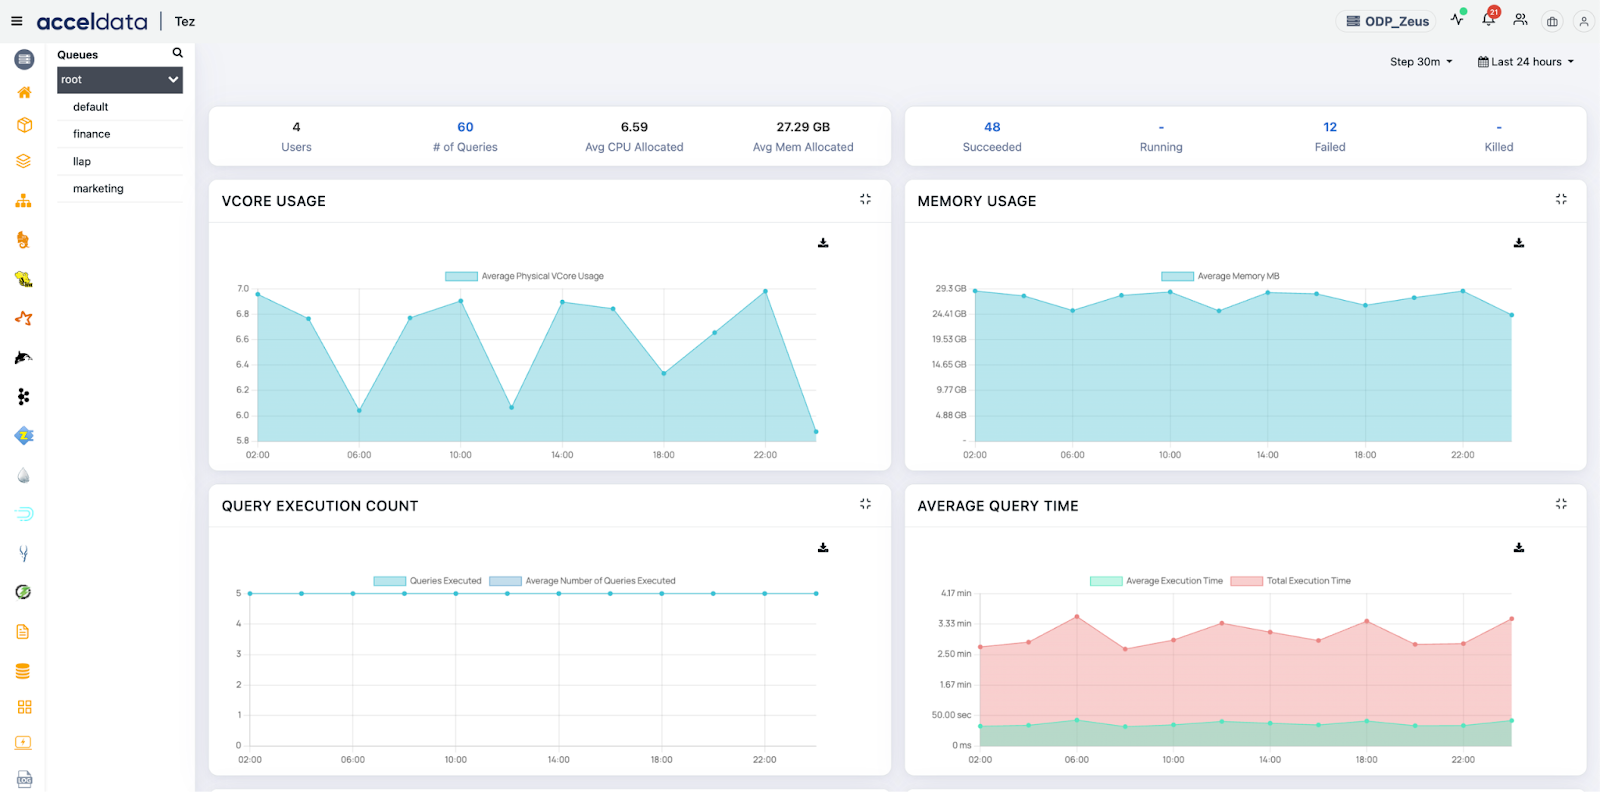
2. Resource Usage Breakdown
Pulse tracks detailed resource consumption by query, DAG, task, and even user, such as:
- CPU and memory utilization
- HDFS I/O throughput
- Container allocation and usage over time
Use Cases:
- Detect resource wastage: Spot queries that allocate large containers but underutilize them (e.g., large memory but low CPU use).
- Forecast resource demand: Use historical usage to predict YARN demand for scheduled or SLA-bound jobs.
- Compare resource profile by user/team: Identify which user/team consumes most cluster capacity and optimize workload mix.
- Right-size DAG vertices: Fine-tune tez.task.resource.memory.mb and tez.am.resource.memory.mb based on actual usage patterns.
3. Automatic Anomaly Detection
Pulse flags behavioral anomalies automatically, using historical baselining and performance profiling:
- Spikes in task retries or failures
- Abnormal DAG durations
- Skew in task completion time or input size
Use Cases:
- Catch performance regressions: Alert if a query that usually runs in 2 minutes suddenly takes 20 minutes.
- Spot skew automatically: Get alerts when some tasks in a stage take significantly longer, often due to uneven data distribution.
- Detect hidden failures: Uncover silently failing retries that degrade performance but don’t surface as outright job failures.
- Find early signals of data quality issues: Anomalies in scan times or partition input size can point to malformed or unexpectedly empty files.
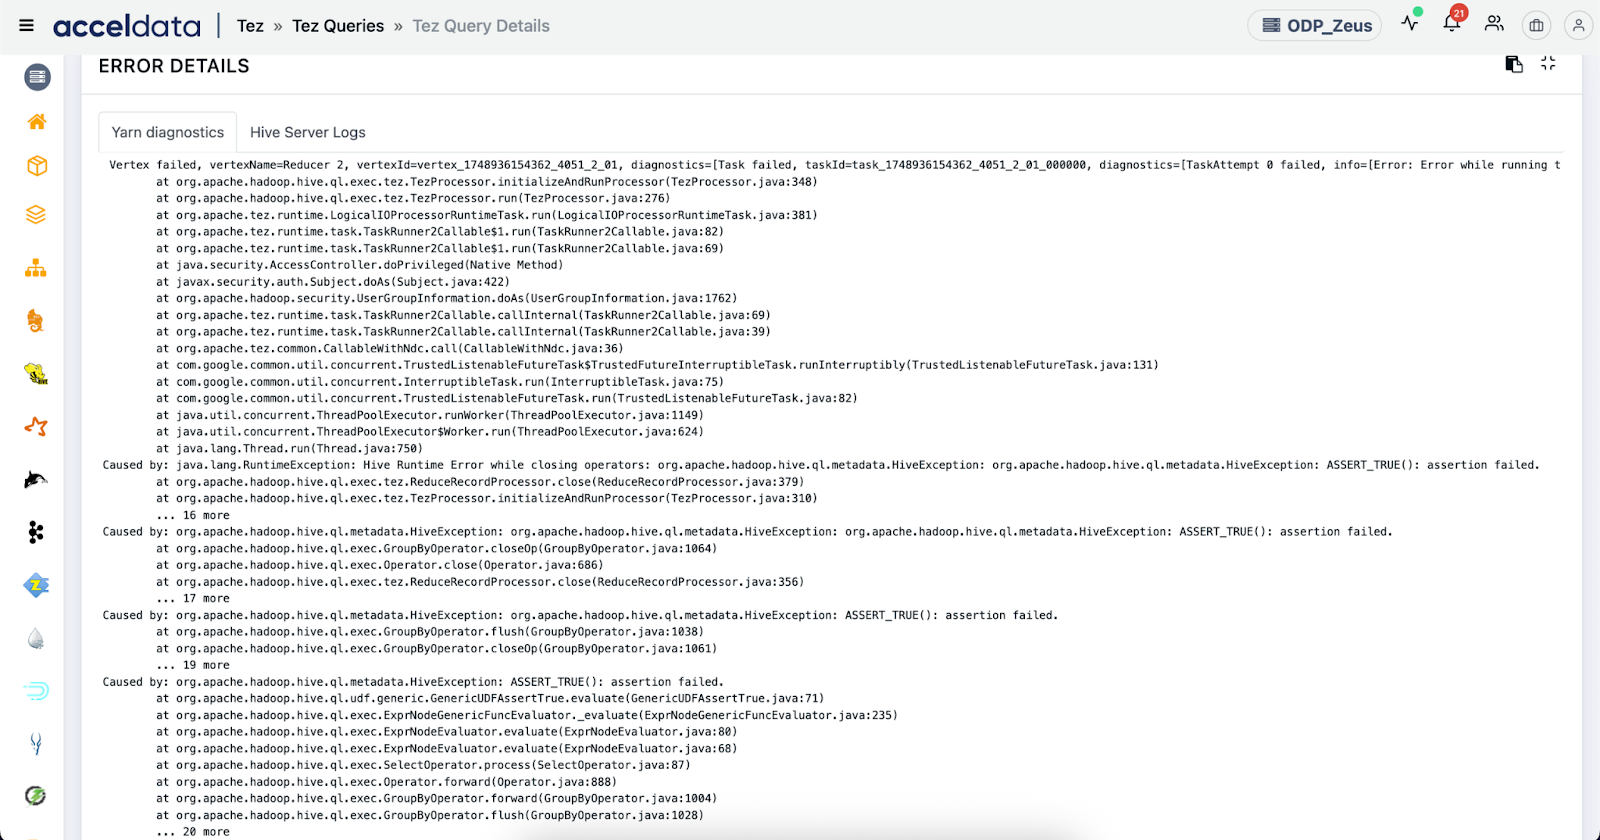
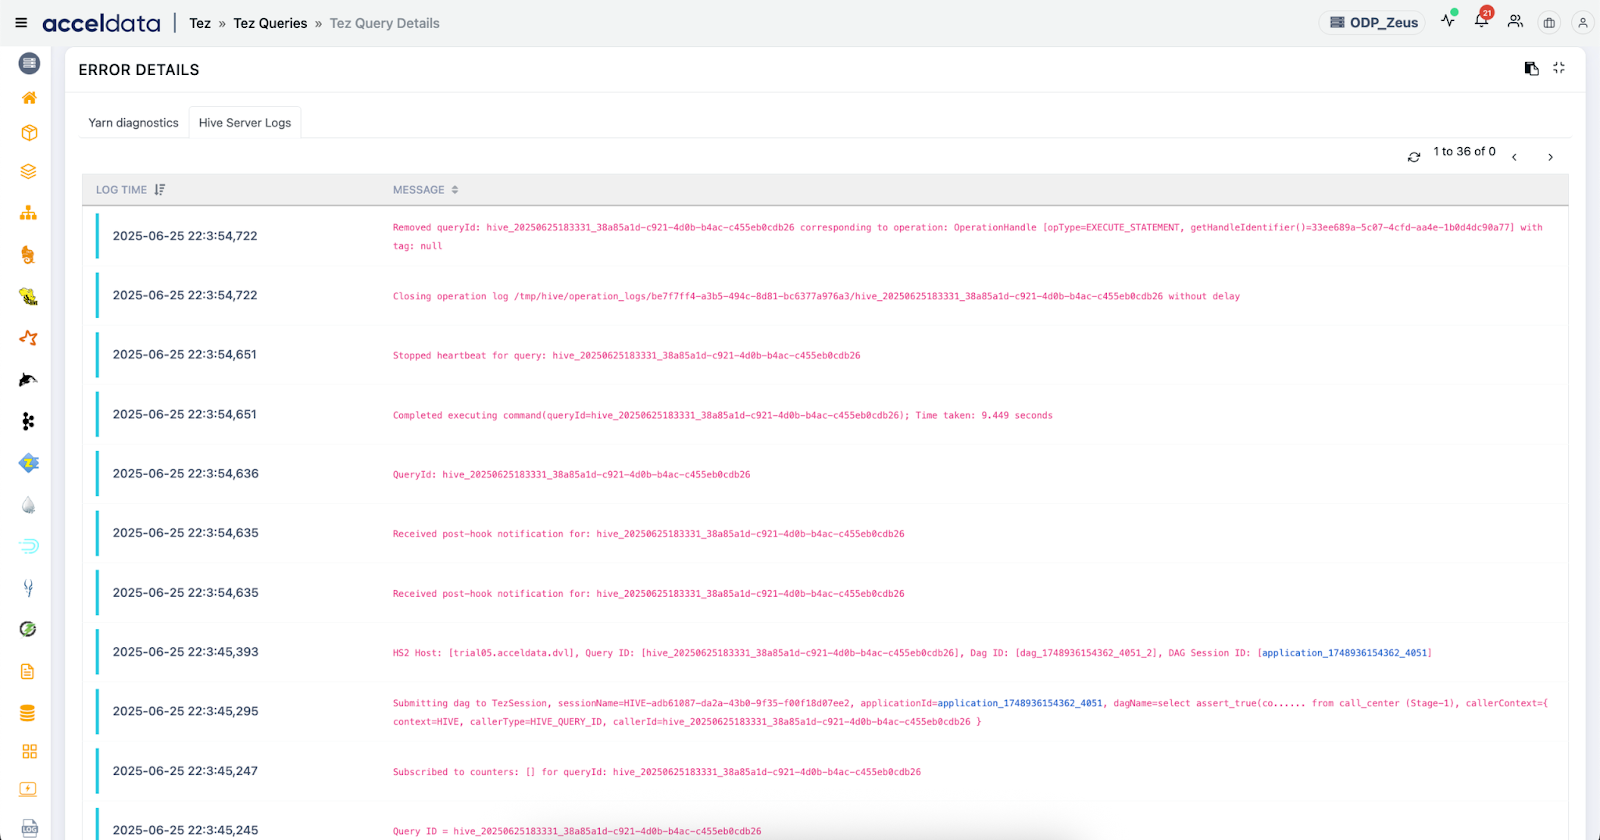
4. Root Cause Insights
Pulse correlates query metrics with system behavior and metadata to pinpoint root causes quickly:
- Detailed error logs from the DAG and AM
- Links to HiveServer2, Tez, and YARN logs
- Schema and partition metadata snapshots
Use Cases:
- Diagnose frequent job failures: Trace back to reasons like missing partitions, invalid SerDe, or schema evolution issues.
- Troubleshoot AM container OOMs: Determine if the issue is caused by large result sets, heavy aggregations, or misconfigured memory.
- Resolve intermittent slowdowns: Identify if slowness is due to transient HDFS or Metastore slowness.
- Track schema drift: Understand if recent DDL changes are affecting query execution downstream.
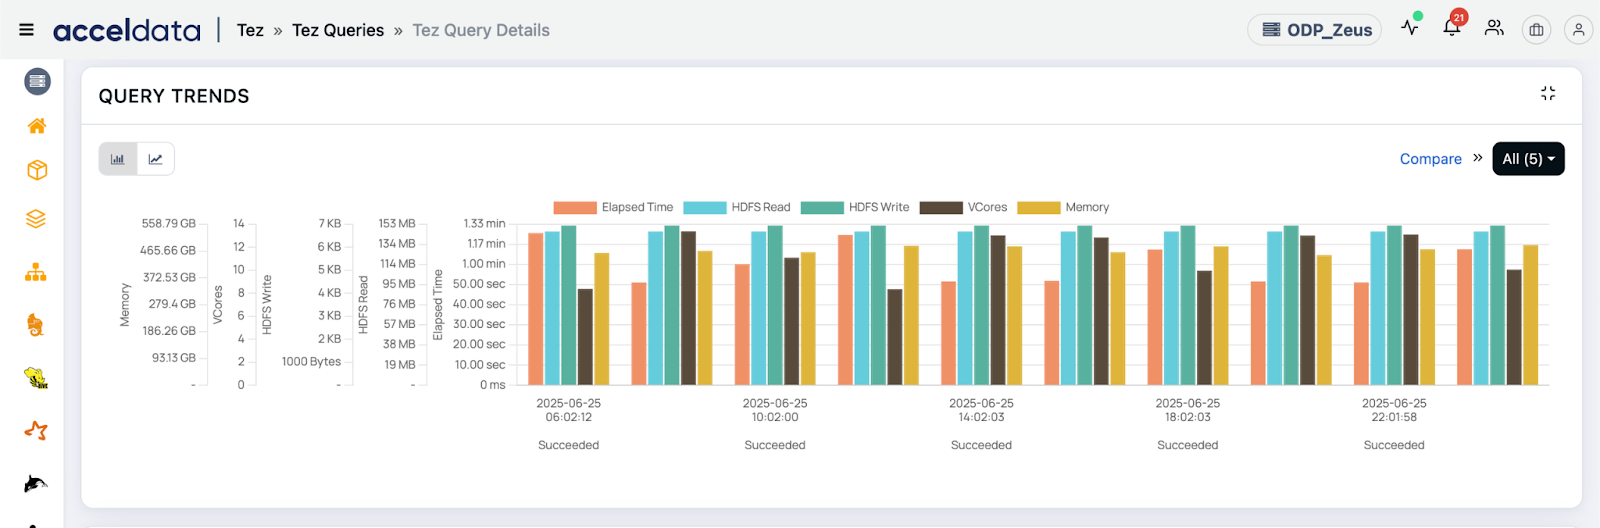
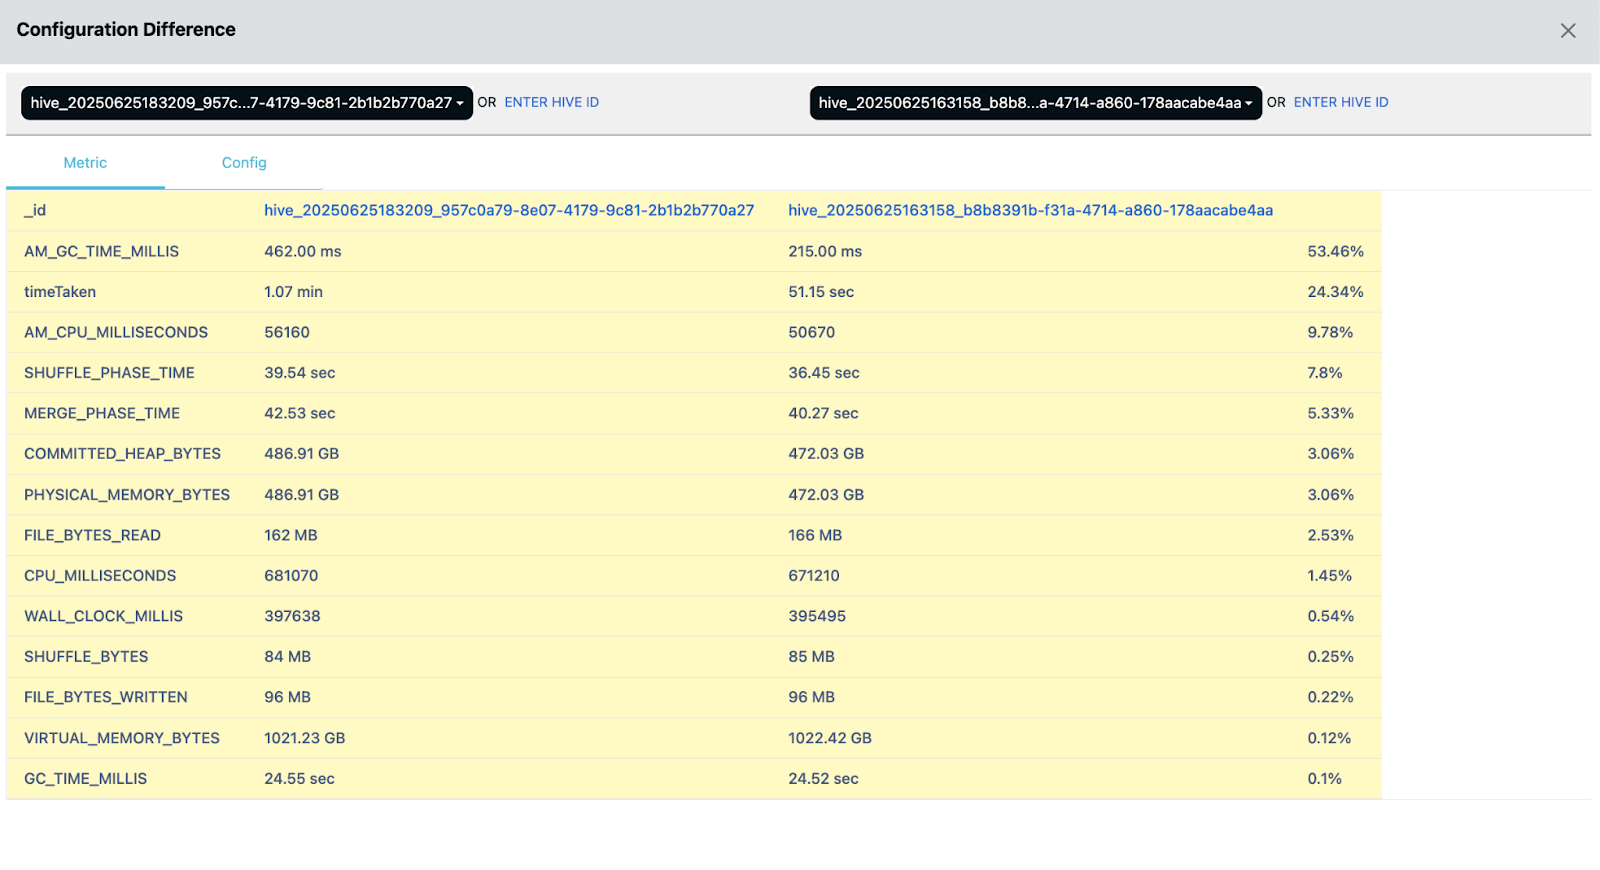
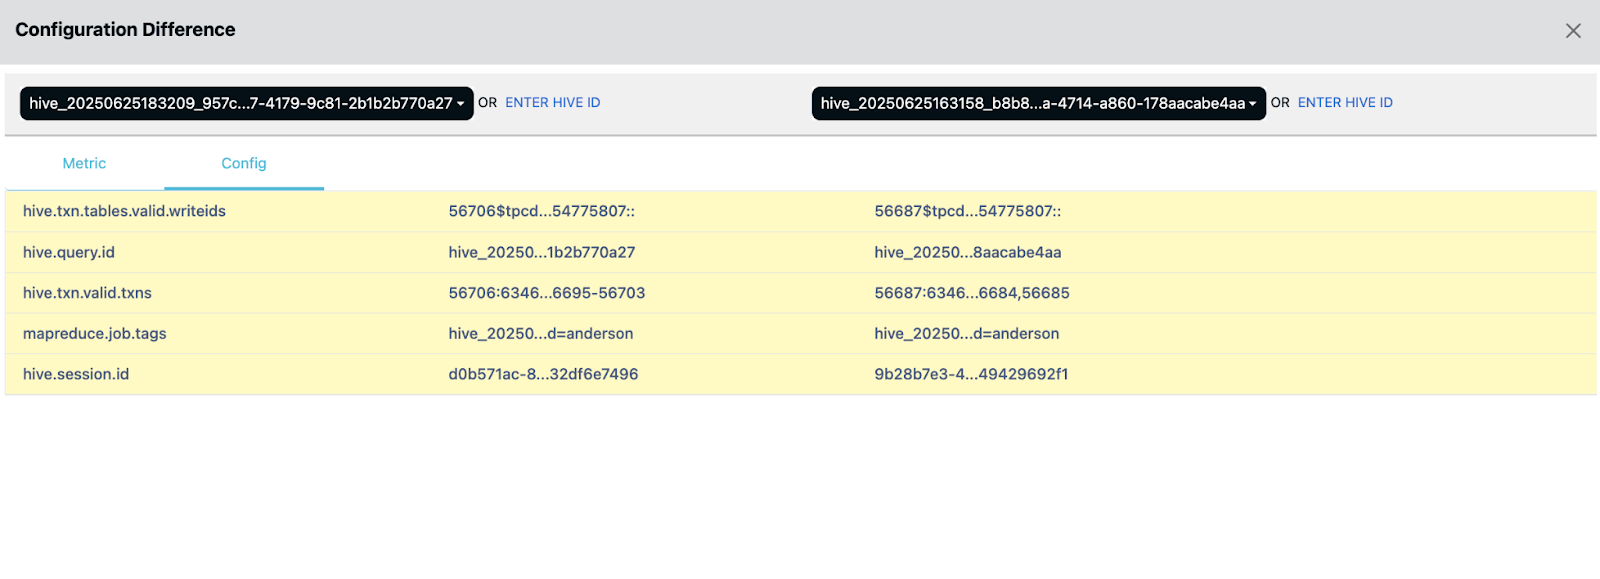
5. Historical Query Comparison
Pulse stores historical runs of queries, allowing teams to compare metrics and execution plans over time:
- Duration, resource usage, shuffle data volume, etc.
- Vertex-level changes across runs
- Schema or metadata evolution over time
Use Cases:
- Analyze impact of code changes: Compare a query before and after optimization to validate improvements.
- Track impact of engine/config changes: See how upgrading Hive/Tez or changing container sizes affects performance.
- SLA trend monitoring: Alert when queries start missing SLA targets even if they don’t outright fail.
- Support incident postmortems: Provide visibility into what changed before a production issue occurred.
6. Integrated System Telemetry
Pulse integrates with HiveServer2, Metastore, YARN, HDFS, and other system components to surface telemetry in one place:
- JVM GC metrics
- Disk & network I/O
- RPC latency and failures
- HiveServer2 concurrency limits
Use Cases:
- Correlate Hive query lag with infrastructure issues: E.g., Tez DAG delays coinciding with high HDFS Namenode GC times.
- Spot cluster-wide congestion: Alert if multiple slow queries correlate with a saturated YARN queue or overused disk.
- Resolve Metastore bottlenecks: Investigate if slow ANALYZE or SHOW PARTITIONS operations are related to RPC latency or metadata bloat.
- Balance resource queues: Understand which YARN queues are over/underused based on real query demand.
Wrapping Up!
Troubleshooting Hive-on-Tez queries without a unified AI-driven data observability platform is time-consuming and inefficient. Acceldata Pulse transforms this experience by offering:
- Full query visibility
- Deep performance insights
- Anomaly detection
- Cross-layer correlation
Whether you’re a platform engineer ensuring YARN resource efficiency or a data developer fixing slow queries, Pulse empowers your team to move faster and build with confidence.
Start observing your Hive workloads the smart way—try Acceldata Pulse and make performance issues a thing of the past.
Want to spot Hive/Tez issues faster with clarity? Click here now!


