


.svg)


So, you've just come across this post: "How to create a data quality dashboard." What's this topic about, and why should you care?
You've probably heard the saying "Data is the new oil." Some versions use "gold" instead of "oil," but the point is easy to get across nevertheless: in this day and age, data is exceptionally valuable.
But just like raw oil, raw data isn't that valuable—it's only after you transform it into something useful that it becomes precious. Refining oil is a complex, multi-step process. If you’re not careful, you may create the wrong product or end up with useless sludge. That's why organizations invest so much in their data strategies, creating infrastructures that clean, refine, purify, and transform data, making it pristine, ready to be queried, and analyzed in a myriad of ways.
However, all of this investment becomes a waste if you can't ensure the quality of your data. In the same way that arguments constructed on a false premise are just as false, strategies based on poor data aren't reliable. Refiners need gauges that allow them to monitor their oil as it moves through the pipes of their refinery. You need tools that allow you to watch your data as it traverses your pipelines, too.
So, since you can't improve what you don't measure, this post is about tracking data quality. In this post, we'll:
- explore why tracking data quality is so vital
- cover some of the main metrics you should care about
- and advise on how to create a data quality dashboard of your own
Let's get started.
Why Should You Track Data Quality?
Why measure data quality? As you've just seen, ensuring data quality is essential because you can't trust insights you obtained from faulty data. But there's more to tracking data quality than that.
Depending on your industry and also on other factors—such as whether your organization is listed on the stock market, handles personal or medical data, or does business with a government—there are strong regulatory compliance rules you must adhere to. Last but not least, ensuring your data is of the highest quality results in increasing stakeholders' trust in your organization.
Tracking data quality helps you be proactive rather than reactive regarding the quality of your data. A comprehensive and usable dashboard allows you to see, at a glance, points that need your attention and take action before the crisis instead of after it begins.

How Do I Ensure Data Quality? Start by Using the Right Metrics
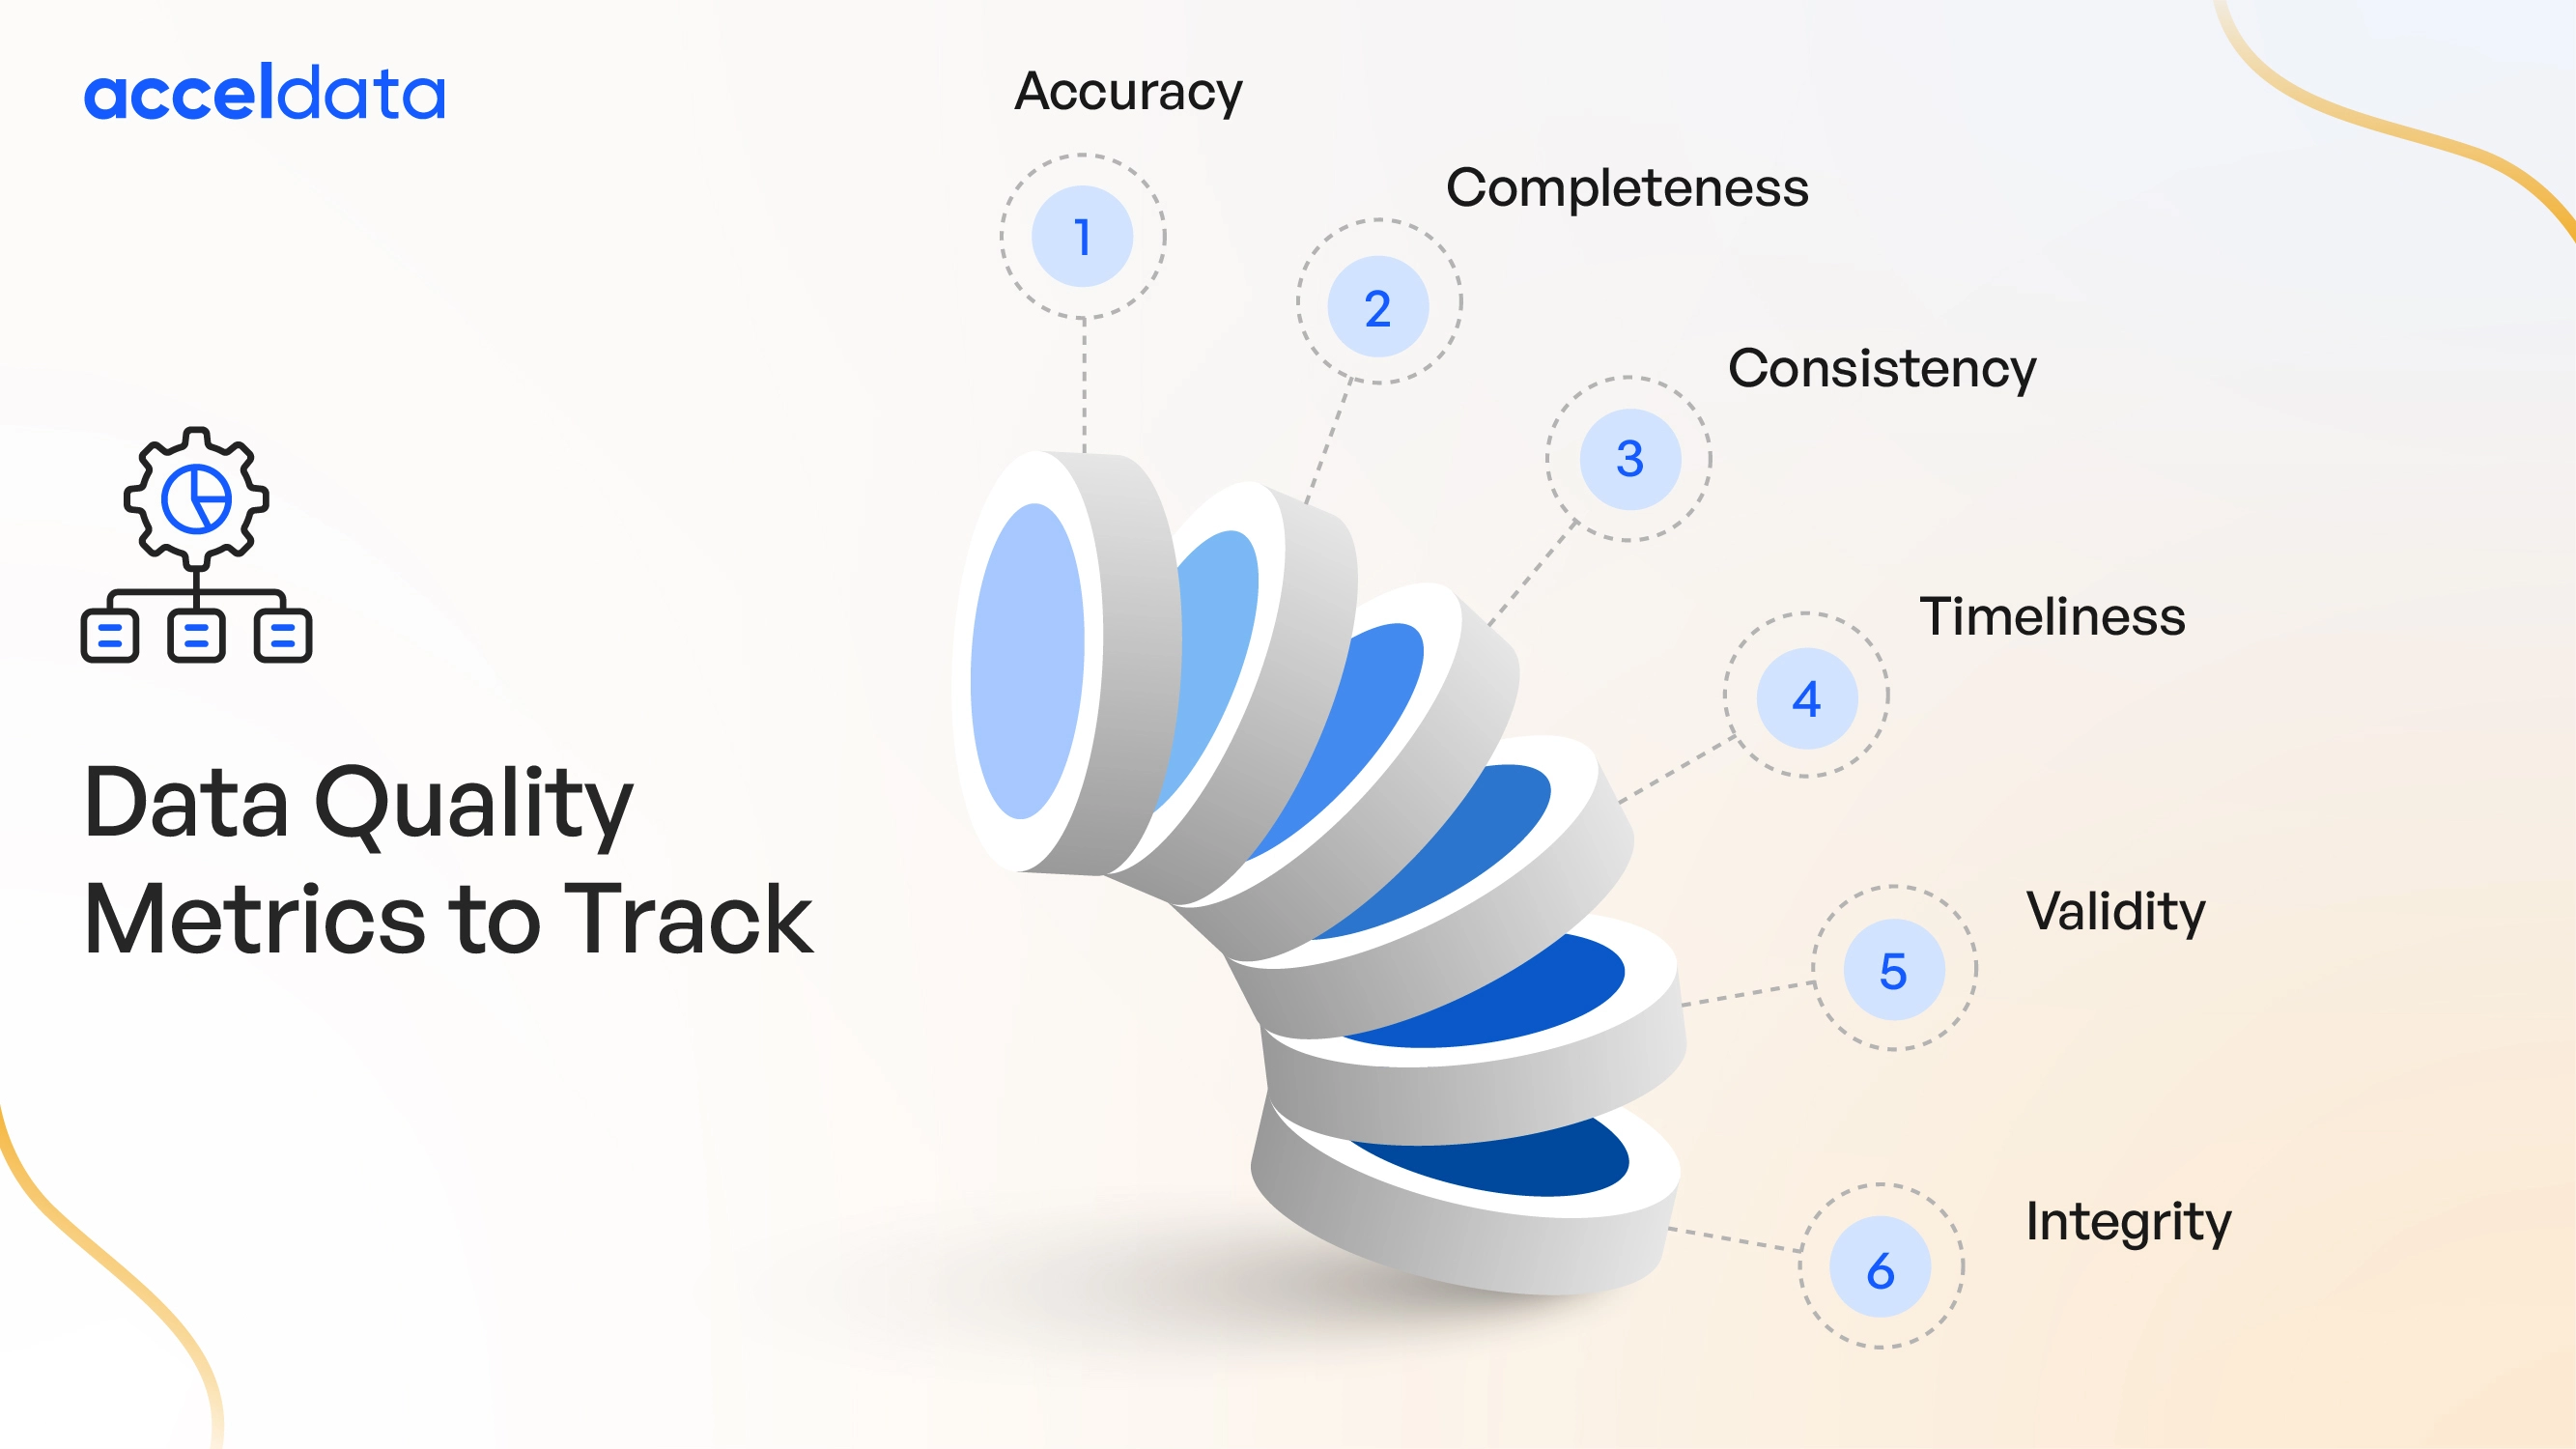
The first step in ensuring data quality is picking the right metrics to track. Here's a non-exhaustive list of some of the most important data quality metrics you could track:
- Accuracy. It refers to how close your data is to the actual values. For example, the net weight of a product as registered in the database versus the actual, measured weight.
- Completeness. It indicates how complete a dataset is—whether all of the required fields or properties are filled, for instance.
- Consistency. This metric evaluates whether a piece of data has the same values across different sources and origins, a problem often tacked by Master Data Management solutions.
- Timeliness. This indicates how up-to-date the data is.
- Validity. People might confuse validity with accuracy, but they're quite different. Validity here refers to whether data adheres to standards, rules, or predefined formats. For instance, formats for zip codes, car license plates, telephone numbers, and so on.
- Integrity. Integrity is all about relationships. If an item from a dataset (e.g., a product) has a reference to an item of another dataset (e.g., a category), we say that the data is integral if the referenced piece of data exists.
Depending on your context, some of the metrics might be of more or less importance. For instance, completeness is often misleading; the simple fact that all of the required pieces of data are there can give a false sense of quality since they still could have completely inaccurate or invalid values.
Accuracy, on the other hand, is much more valuable since it demonstrates how correct the recorded data is regarding real values—at the same time, it's one of the hardest ones to measure for this reason.
A piece of data that once was accurate, complete, and valid will not necessarily remain that way forever, though. And that's why timeliness is of major importance as well.
Data Quality Dashboard: How to Create One in 5 Steps
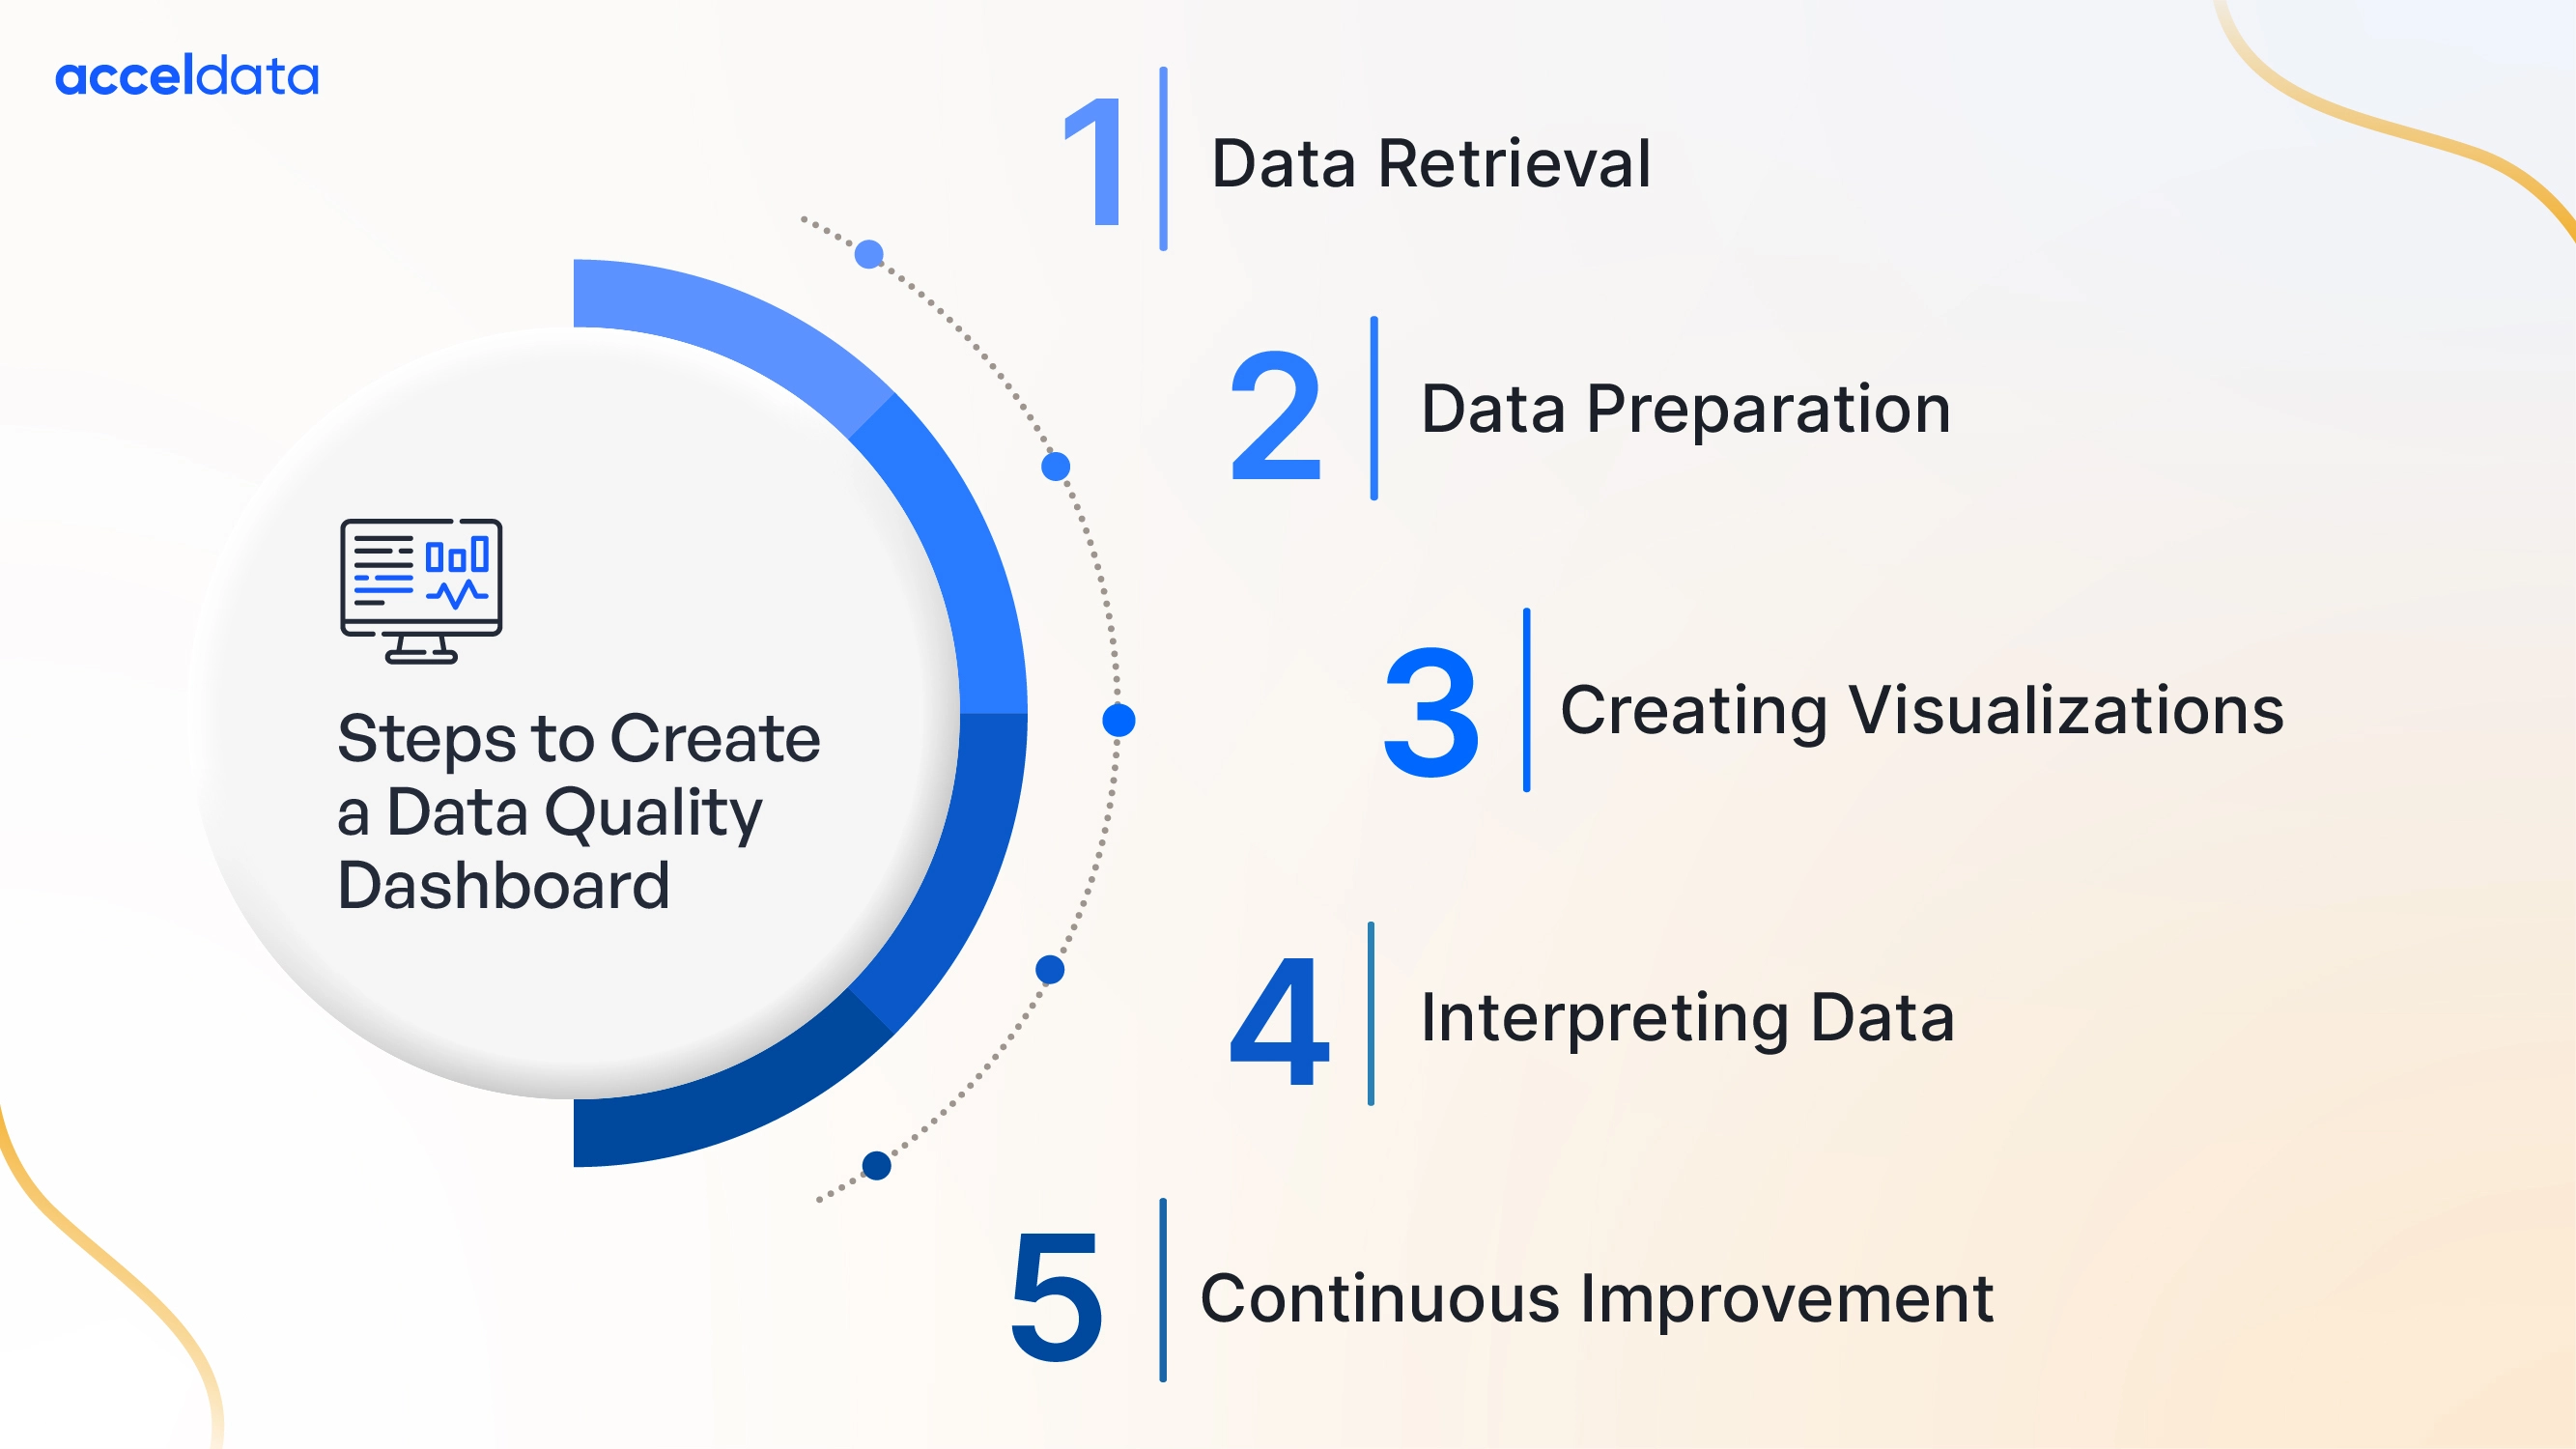
Having covered the importance of data quality and why we measure it, it's time to talk about building a data quality dashboard.
1. Data Retrieval
If your goal is to build a data quality dashboard, your first step won't ever be that different. You have to start by gathering the necessary data through metrics that will help you evaluate the health of your data. At this step, a data observability tool like Acceldata shines with its integrations to a wide array of data sources, such as Snowflake, Databricks, BigQuery, Azure SQL Warehouse, and more.
2. Data Preparation
After gathering the necessary data, you have to ensure it's of good use. That's why the metrics we've just covered are so important, especially validity and accuracy. Acceldata's reliability features let you see at a glance several data points related to the data reliability, as well as add and manage data quality policies.

3. Creating Visualizations
As soon as you've retrieved and prepared your data, the next step is to display it, in ways that are both easy to understand and interpret but also engaging. Here's the step where you should make the most of the capabilities of your data observability platform, employing all of the widgets at your disposal to create engaging graphics and charts.

4. Interpreting Your Data
Having impactful human-friendly visualizations is a powerful feature, but it's also vital to interpret the data that your platform shows you. This is a step where a platform like Acceldata excels, by offering powerful policies you can use to create rules that enforce data quality. Such policies include:
- data freshness, which ensures data is up to date
- data anomaly detection, which ensures the identification of anomalies in the data set
- reconciliation, which ensures consistency across assets
- data quality, which evaluates the health of your data according to business or consumer needs
5. Continuous Improvement
The final step on our list is an eternal step: after you have your data quality process and dashboard up and running, the next step is to constantly evaluate your results and improve upon them. Monitor your dashboard constantly and update it when needed—that way, you ensure it'll remain as relevant as possible. You should share your dashboard with people inside and out of your team, to gather their feedback, encourage conversations about data quality, and brainstorm future improvements.

Conclusion
Data nowadays is the most valuable asset companies of all sizes have. But just like many assets, data is pretty much useless when not refined and processed. Because of that, organizations build complex initiatives to ensure they can store, clean, structure, transform, and analyze all of their data.
Through this analysis, they can come up with novel insights that are then used as input for strategic decisions. The danger lies in the health—or lack thereof—of said data. If you can't ensure the quality of your data, then you can't really trust the insights you gain from it.
In this post, you've learned about the importance of data quality and the main data quality metrics you should consider tracking. You've also read some advice on how to create and maintain a data quality dashboard, which is facilitated with the help of a data observability platform such as Acceldata.


