


.svg)


Introduction: The Hidden Power of HDFS Metadata
In modern data infrastructures, Apache Hadoop’s HDFS (Hadoop Distributed File System) continues to serve as a foundational layer for storing and processing large-scale data. However, despite its widespread use, one of its most critical components—the fsimage—remains largely opaque and underutilized by most organizations.
The fsimage is a serialized, binary snapshot of the entire HDFS namespace at a point in time. It includes all files, directories, symbolic links, block-to-file mappings, replication factors, ownership (user and group), permissions, ACLs, timestamps, quotas (namespace and storage), extended attributes (XAttrs), storage and erasure coding policies, encryption zone metadata, inode IDs, and references to user-created snapshots. While it plays a foundational role in how the NameNode maintains consistency and performs recovery, fsimage data is virtually inaccessible in its raw form, making it challenging for administrators to leverage for proactive operations, auditability, or optimization.
This post explores how Acceldata Pulse radically simplifies and enhances fsimage analysis by transforming binary metadata into an accessible, searchable, and scalable observability platform.
Understanding fsimage: The Blueprint of Your Hadoop Cluster
The fsimage file, along with the edit logs, represents the persistent state of the Hadoop filesystem. Here's how it functions:
- fsimage: A serialized file containing a point-in-time snapshot of the entire HDFS namespace.
- Edit logs: Record changes (creates, deletes, permission updates) made since the last fsimage checkpoint.
When the NameNode restarts, it loads the fsimage and then replays the edit logs to reconstruct the most recent state of the filesystem.
Key contents of the fsimage include:
- Directory hierarchy
- File and folder names
- Block mappings
- Ownership and POSIX permissions
- Replication factor
- Quota limits and consumption
- Access and modification timestamps
However, due to its binary Protobuf format, direct access to fsimage data requires using Hadoop’s offline tools (e.g., OfflineImageViewer), which convert it to XML or plain text. These output files are:
- Extremely large and verbose, often several GBs for large clusters
- Difficult to query or visualize
- Not suitable for dynamic exploration or real-time troubleshooting
Limitations of Traditional fsimage Analysis Approaches
Manual and Script-Based Limitations:
- OfflineImageViewer XML output becomes unmanageable at scale.
- Requires writing custom scripts in Python, Bash, or Java to extract relevant metrics.
- No native indexing or search capability—every query becomes a full file scan.
- Slow turnaround times for even basic queries like “show me all files >1GB not accessed in 6 months.”
- Analysis is inherently reactive rather than proactive.
This lack of visibility and speed introduces risk—issues like small file proliferation, stale data, or quota breaches go unnoticed until they cause failures.
Acceldata Pulse: Turning fsimage into an Actionable Observability Layer
Acceldata Pulse addresses these limitations head-on by automating the ingestion, parsing, and indexing of fsimage data into Elasticsearch—enabling fast, scalable exploration and near real-time observability with configurable data refresh intervals.
Key Architectural Advantages:
- Automated fsimage extraction and parsing from Hadoop clusters
- Structured indexing into Elasticsearch for fast, filtered queries
- Integration with Acceldata Pulse dashboards and alerting engine
- No downtime or intrusive operations on the live cluster
Once ingested, fsimage metadata becomes a live, queryable data source for operations, compliance, capacity planning, and optimization.
Pulse HDFS File Explorer: Operational Intelligence at Scale
At the core of fsimage observability in Pulse is the HDFS File Explorer, an intuitive yet powerful interface to navigate HDFS metadata at scale.
Key Capabilities:
This feature set allows administrators to shift from static CLI-based commands (hdfs dfs -ls) to interactive, performance-aware exploration, even for large directory trees that would otherwise time out or stall in traditional methods.
This feature set allows administrators to shift from static CLI-based commands (hdfs dfs -ls) to interactive, performance-aware exploration, even for large directory trees that would otherwise time out or stall in traditional methods.

Use Case: Navigating Large and Deep Directory Structures
Large directories in HDFS are common—and problematic:
- Operations like ls or du can timeout on large folders
- Hidden small file problems often accumulate inside nested paths
- Long, deeply nested structures hinder data discoverability and governance
Pulse’s Explorer solves these challenges with:
- Folder size summaries
- Recursive and nested directory views
- Filters to surface empty folders, cold files, or stale directories
- Drill-down propagation of filters for context-aware exploration
This is a significant productivity boost for platform engineers, data engineers, and infra SREs.
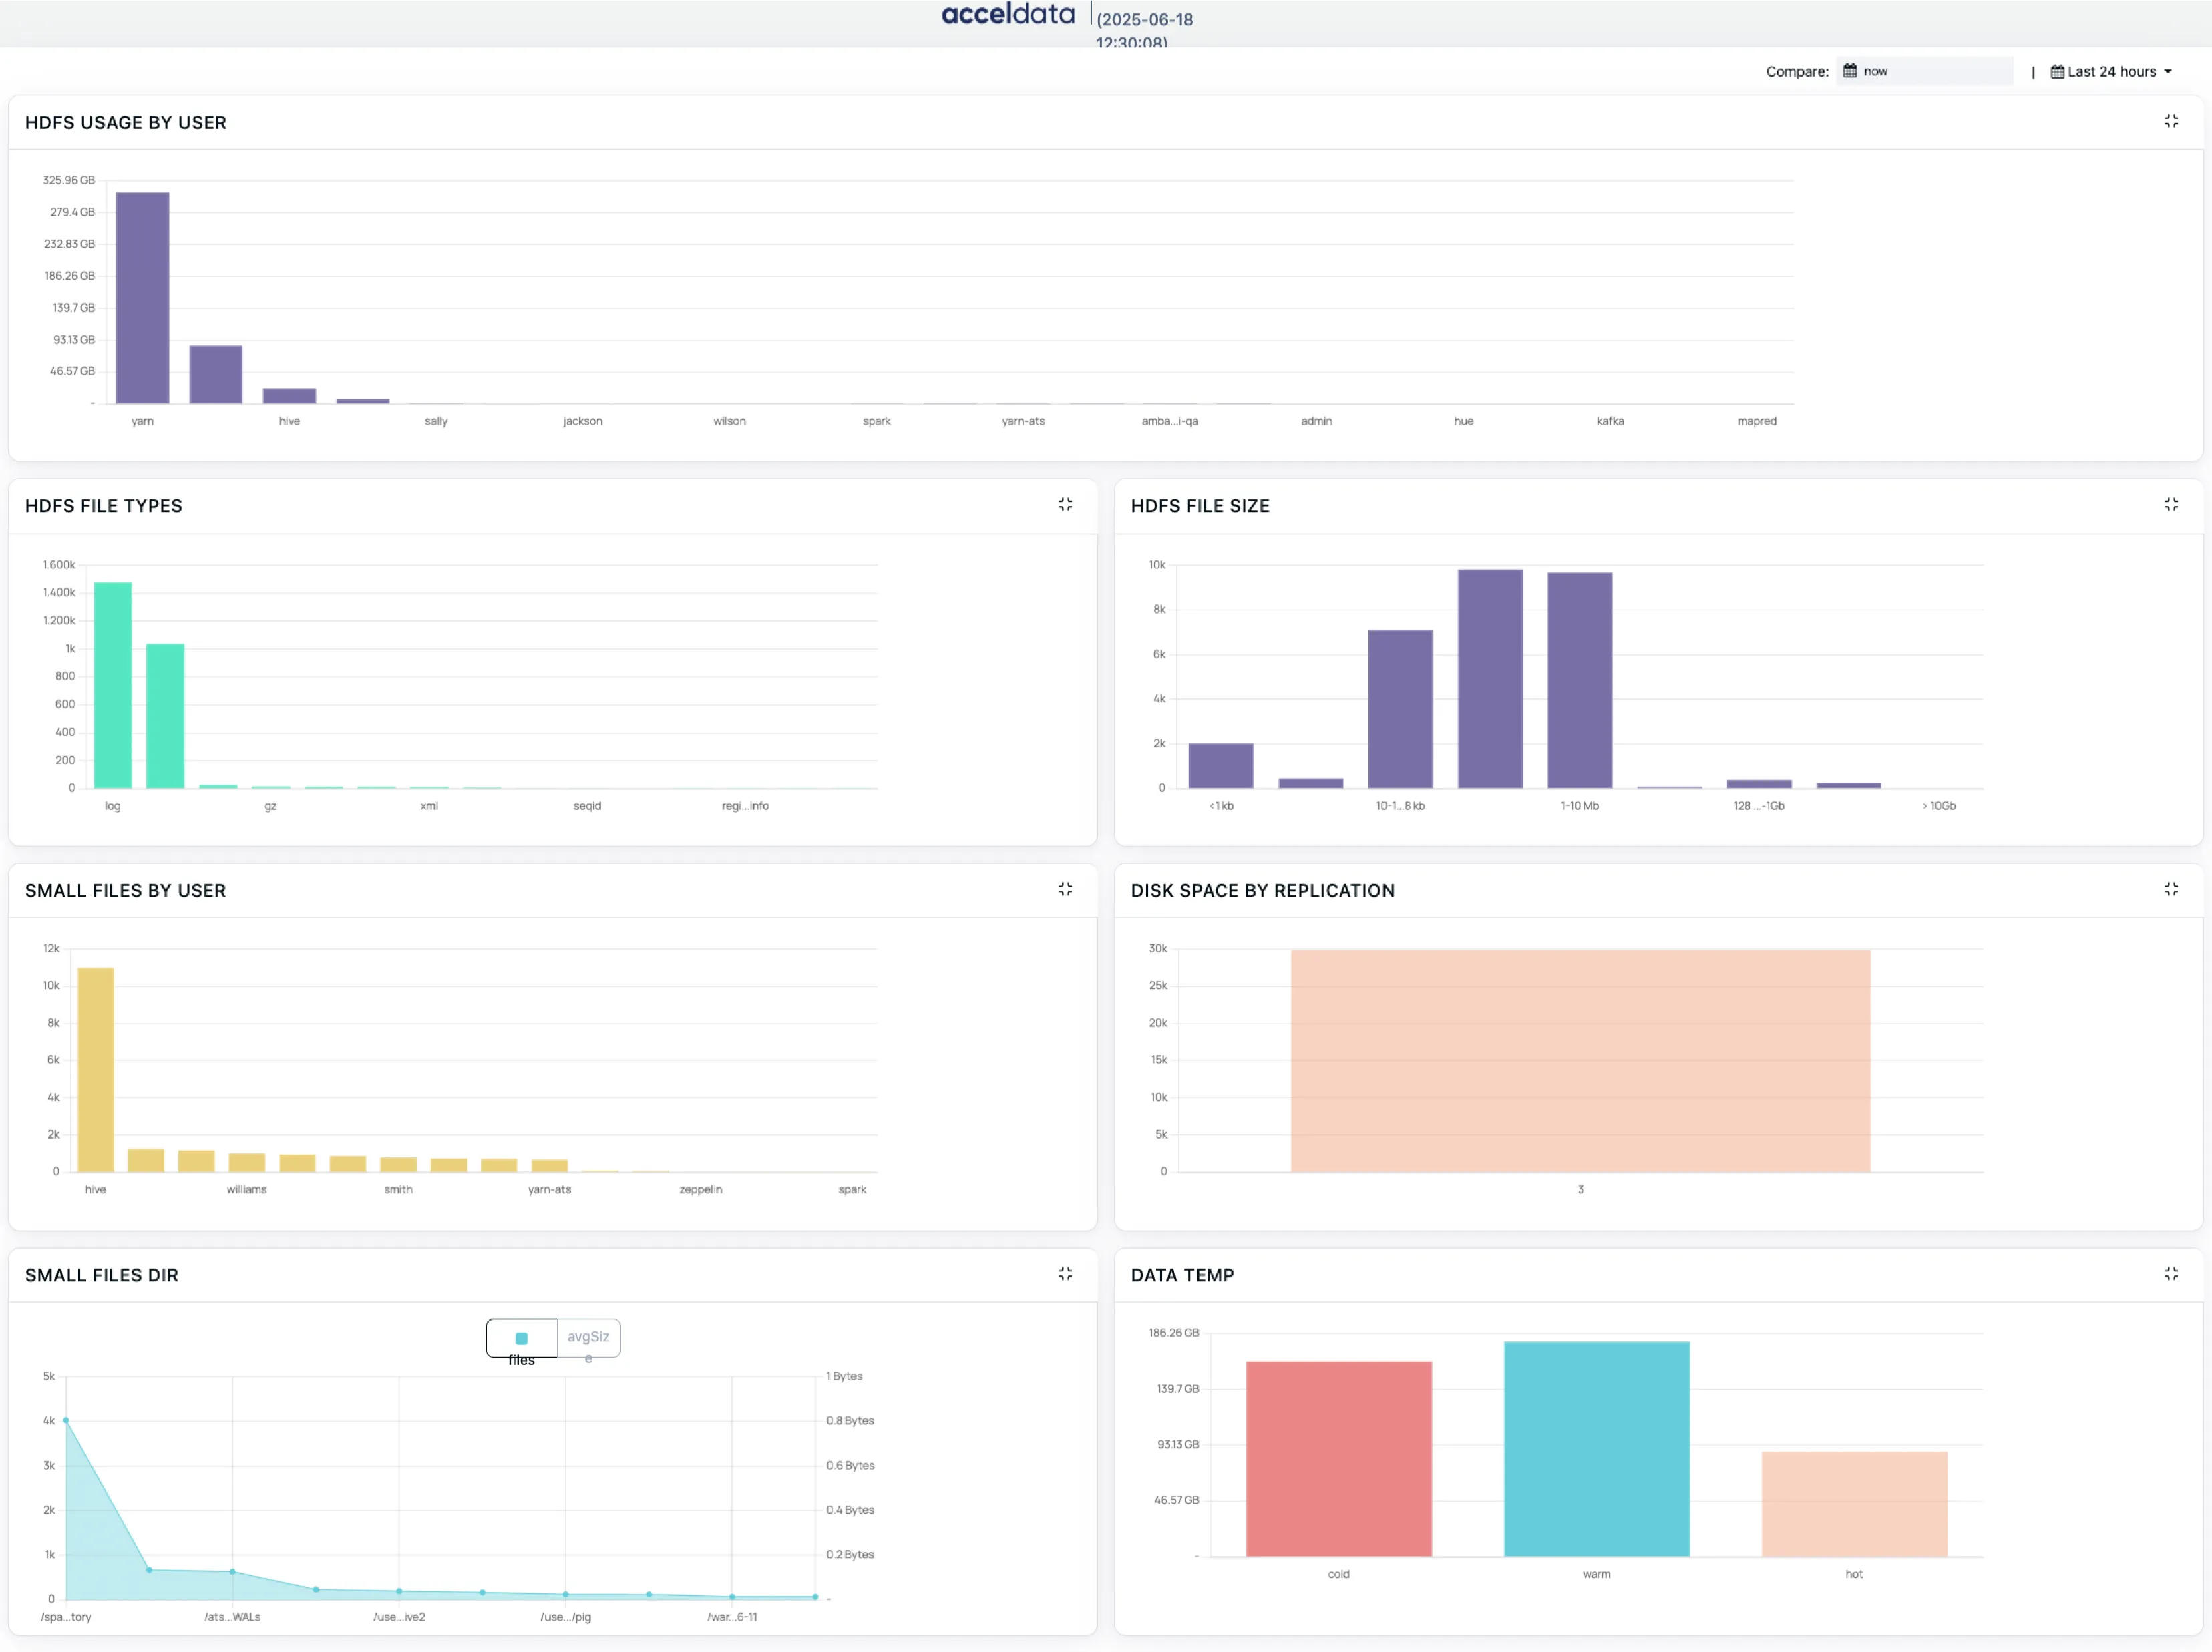
Pulse Analytics Dashboards: Fast Insight into Common HDFS Problems
Beyond navigation, Pulse offers a suite of ready-to-use analytics dashboards that highlight operational inefficiencies and risk areas:
Small Files Dashboards
- By User: Identify users or applications generating the most small files
- By Directory: Pinpoint directories with high small file density
These are often the root causes of NameNode performance degradation.
Data Temperature & Lifecycle Dashboards
- Files by Temperature (Hot/Warm/Cold): Categorized by last access timestamps
- File Age Distribution: Measure stale vs. active data volumes
Facilitates cold data tiering, storage optimization, and retention policy enforcement.
HDFS Usage by User
- Quickly identify top consumers of HDFS storage
- Understand usage distribution across users or teams
- Navigate directly to specific users' paths in File Explorer with a single click
HDFS File Size Distribution
- View file counts across size buckets: <1KB, 1–10KB, 10–128KB, etc.
- Filter files by size directly from the dashboard
- Instantly drill down into those files in File Explorer, filtered by size range
Interactive Navigation & Filtering
- Clickable dashboard elements: size buckets, temperature zones, users, and directories
- Automatically apply filters in File Explorer based on chart selections
- Enable deep, context-aware navigation without manual queries
Exportable Reports
- Export any dashboard view or filtered dataset for offline analysis or audit
- Support governance workflows, compliance tracking, and capacity reviews
Operational Benefits
- Get instant visibility into who, where, and how storage is being used
- Pinpoint small file hotspots and optimize ingestion patterns
- Track and act on data aging, growth trends, and quota thresholds
- Enable self-service exploration for platform and governance teams
Real-World Impact: Operational Efficiency through Metadata Intelligence
Example 1: Small File Remediation
- Problem: Ingestion service writes millions of 1KB logs per day.
- Solution: Use Pulse to filter small files by that user → Drill into affected directories → Export path list for refactoring or compaction.
Example 2: Cold Data Tiering
- Problem: Storage costs increasing with no recent access.
- Solution: Filter cold files >100MB untouched for 6+ months → Export list for S3 archival or HDFS deletion policy.
Example 3: Quota Governance
- Problem: Quota enforcement failures due to lack of visibility.
- Solution: Use Pulse dashboards to monitor NSQuota and DSQuota
Advanced Use Case: Custom Dashboards with fsimage Data Using Pulse Dashplot
Pulse goes beyond default charts. Since fsimage metadata is indexed in Elasticsearch, advanced users can:
- Design customized visualizations using Pulse Dashplot
- Define and apply anomaly detection rules
- Monitor directory/HDFS growth trends to flag data accumulation patterns
- Track compliance metrics (e.g., file age distribution by business unit)
This turns static HDFS metadata into a live observability fabric, integrated into broader data reliability and governance programs.
With Pulse Dashplot, users can also build advanced custom dashboards to:
- Track daily average HDFS growth and visualize used capacity trends for forecasting and capacity planning
- Analyze per-user usage patterns over time to detect spikes, enforce quotas, and optimize storage allocation
- Compare application-level HDFS usage across time periods to identify high-growth apps and pinpoint unusual storage consumption
- Monitor small file trends by user or application, helping teams reduce NameNode pressure and improve storage efficiency
- Highlight sudden changes in usage across apps or directories, supporting proactive troubleshooting and governance enforcement
These custom dashboards empower platform teams with precise, visual, and timely insights—enabling data-driven decisions to optimize HDFS health, performance, and cost-efficiency.
Conclusion: Operationalizing Your HDFS Metadata with Acceldata Pulse
The HDFS fsimage is a rich, authoritative source of truth for your Hadoop cluster—but traditionally locked away in binary formats and difficult tooling.
With Acceldata Pulse, organizations gain:
- Full visibility into the HDFS namespace at scale
- Interactive file system exploration
- Automated metadata extraction and filtering
- Proactive dashboards for small files, quotas, and data lifecycle
- Customizable insights for governance, compliance, and operations
By bridging the gap between low-level filesystem metadata and high-level observability, Pulse empowers platform teams to move from reactive firefighting to strategic optimization.
Ready to get started?
If you’re managing Hadoop clusters and need better insight into your storage, usage, or performance, Acceldata Pulse’s fsimage integration is an essential capability to operationalize your metadata and ensure resilient, efficient infrastructure.
Looking to Manage Hadoop more intelligently? Discover how it’s done!


