


.svg)


.webp)

The Need to Observe NiFi Clusters: A Cross-Team Perspective
Apache NiFi powers some of the most critical data pipelines in modern data platforms. But while building flows is easy, keeping them healthy at scale is not. Without proper observability, even small issues can ripple into major data delays, SLA breaches, and sleepless nights.
NiFi is powerful, but without robust observability, it’s also fragile.
As data volumes grow and pipelines scale, NiFi clusters face increasing stress. Application teams need flows to stay performant and resilient. Platform teams must ensure uptime, resource availability, and cluster stability.
This is where monitoring NiFi isn’t just helpful—it’s essential.
Why does Observability matter?
Observability isn’t just about dashboards—it's about ensuring data arrives on time, systems stay healthy, and teams can respond before users notice a problem.
Without it, platform teams get blindsided by infrastructure issues, and application teams are stuck in post-mortem mode
To ensure your data pipelines run smoothly, your teams need shared visibility into NiFi’s behaviour. Monitoring transforms chaos into control, firefighting into foresight, and finger-pointing into collaboration.
Whether you're running a small dev cluster or a global-scale NiFi deployment, the question isn’t if you need to monitor—it's how soon you can start.
Challenges Faced by Platform/Ops Teams
1. Node-Level Failures Go Unnoticed
- NiFi node-level issues
- The node is disconnected
- Heartbeats are missed
- JVM is under pressure
2. Resource Management Headaches
- NiFi eats CPU, RAM, disk I/O—and usage is unpredictable across processors or pipelines.
- Without monitoring, teams can’t proactively scale or balance load.
3. Troubleshooting Is Reactive
- By the time a ticket lands, the logs are stale and the metrics are lost.
- Diagnosing GC spikes or thread exhaustion is painful without JVM metrics over time.
4. Upgrade Risks
- Upgrades are risky without benchmarking:
- “Did this new version improve anything?”
- “Why is throughput down after deployment?”
Challenges Faced by Application Teams
1. Hidden Flow Failures
- Processors stop silently (e.g., invalid state, backpressure), and no alerts are triggered.
- Flow files may queue endlessly or get dropped.
2. Performance Blind Spots
- It's hard to tell whether slowness is due to:
- Source system lag
- Flow misconfiguration
- NiFi resource contention
3. Debugging Is Tedious
- Without proper observability, debugging involves:
- Checking logs across nodes
- Clicking through UI tabs
- Manually tracing flow file lineage
4. SLA Violations
- Teams commit to delivering data every X minutes—but without alerting, failures are discovered after they’ve impacted downstream systems or users.
Mastering NiFi Monitoring: A Guide to Using Acceldata Pulse
How Platform Teams Can Monitor NiFi Clusters with Acceldata Pulse
You’re not just keeping NiFi up—you’re keeping data moving. Pulse gives you the visibility to do both, across every cluster you run.
With Acceldata Pulse, platform teams can monitor multiple NiFi clusters from a single, unified interface, gaining real-time insights into each cluster’s health, performance, and flow behaviour through powerful dashboards and intelligent alerting.
Real-Time Dashboards: Instant Visual Insights
Pulse offers a centralised, intuitive view of your NiFi environment—across nodes, JVM internals, flow stats, and more.
1. Service Monitoring
Quickly assess cluster health with metrics like:
- Node availability and connectivity
- Overall cluster stability
All of this is accessible directly in the NiFi overview section of Pulse.
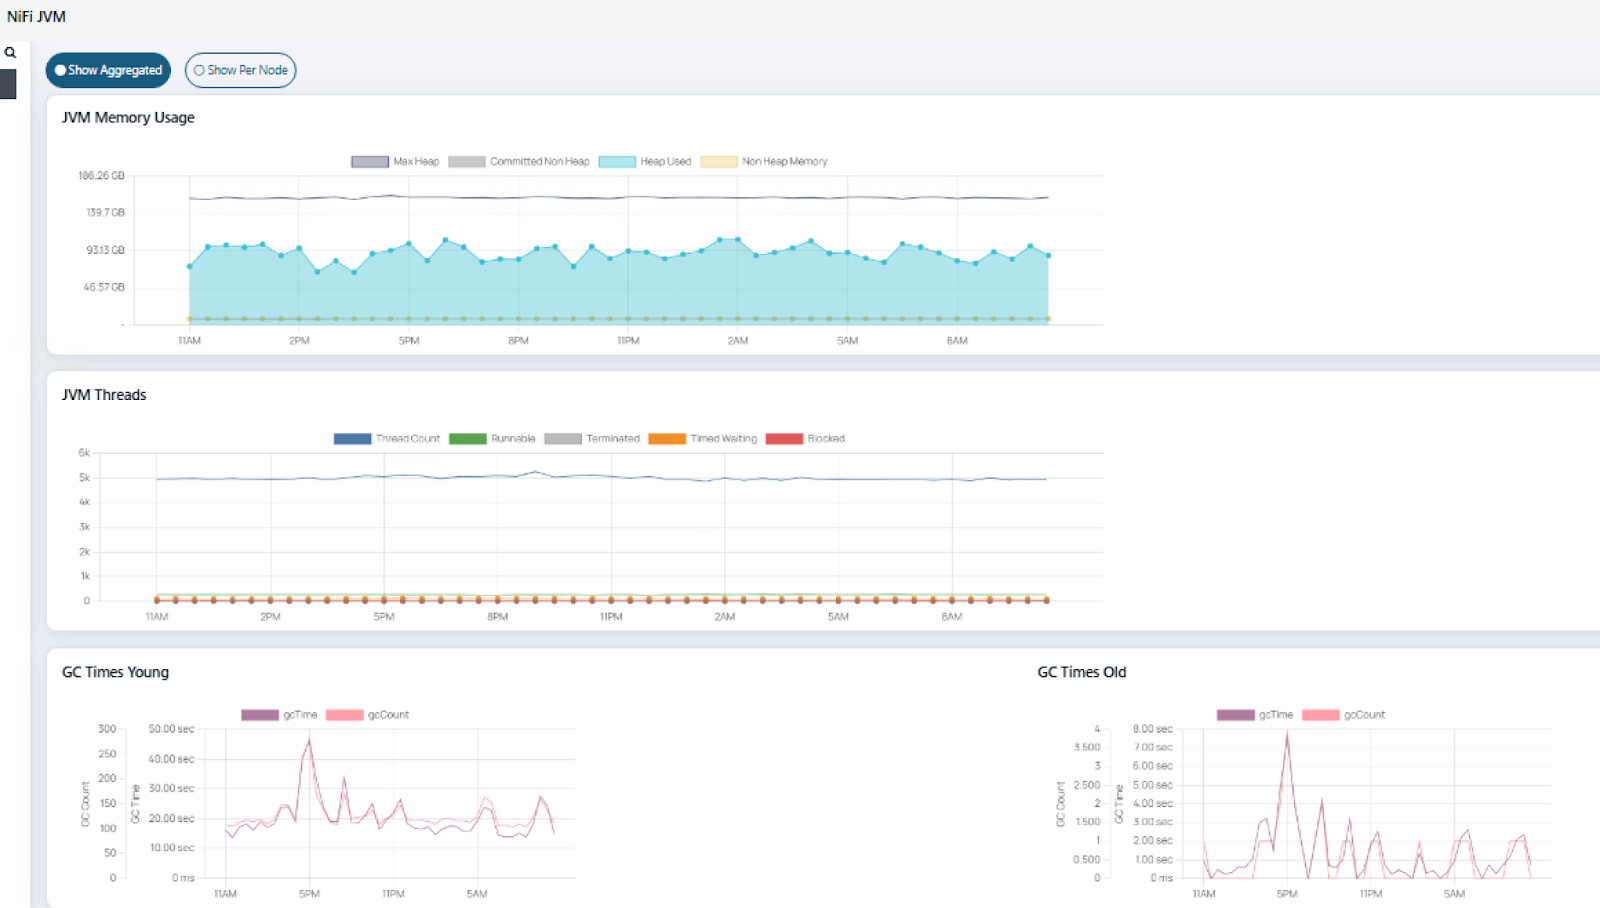
2. JVM Health Monitoring
The built-in JVM dashboard visualises:
- Heap vs. non-heap memory usage
- Thread state distribution
- Garbage collection (GC) pause times
Metrics can be explored at a cluster-wide level or per-node for detailed diagnostics.
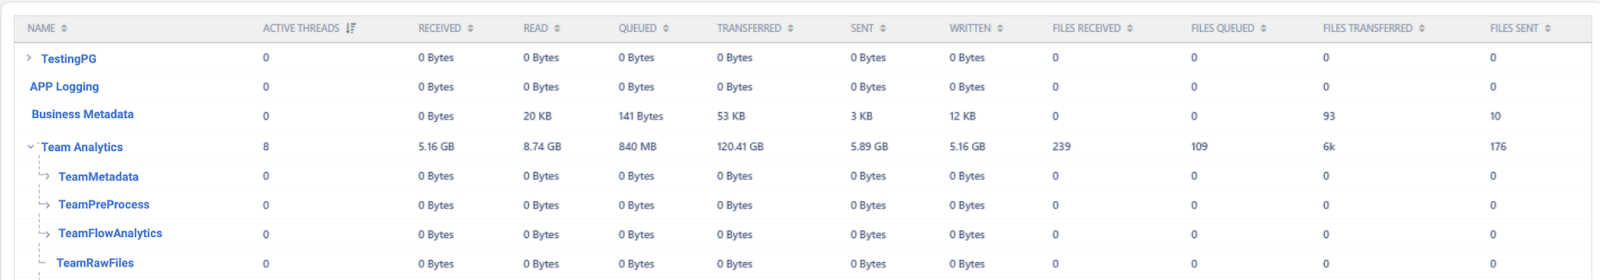
3. Process Group Metrics
Get visibility into how each process group is behaving:
- Active thread count
- Volume of data read, written, and transferred
- Queue lengths and failure metrics
You can drill down into specific nodes or groups to inspect I/O operations and processing times in detail.
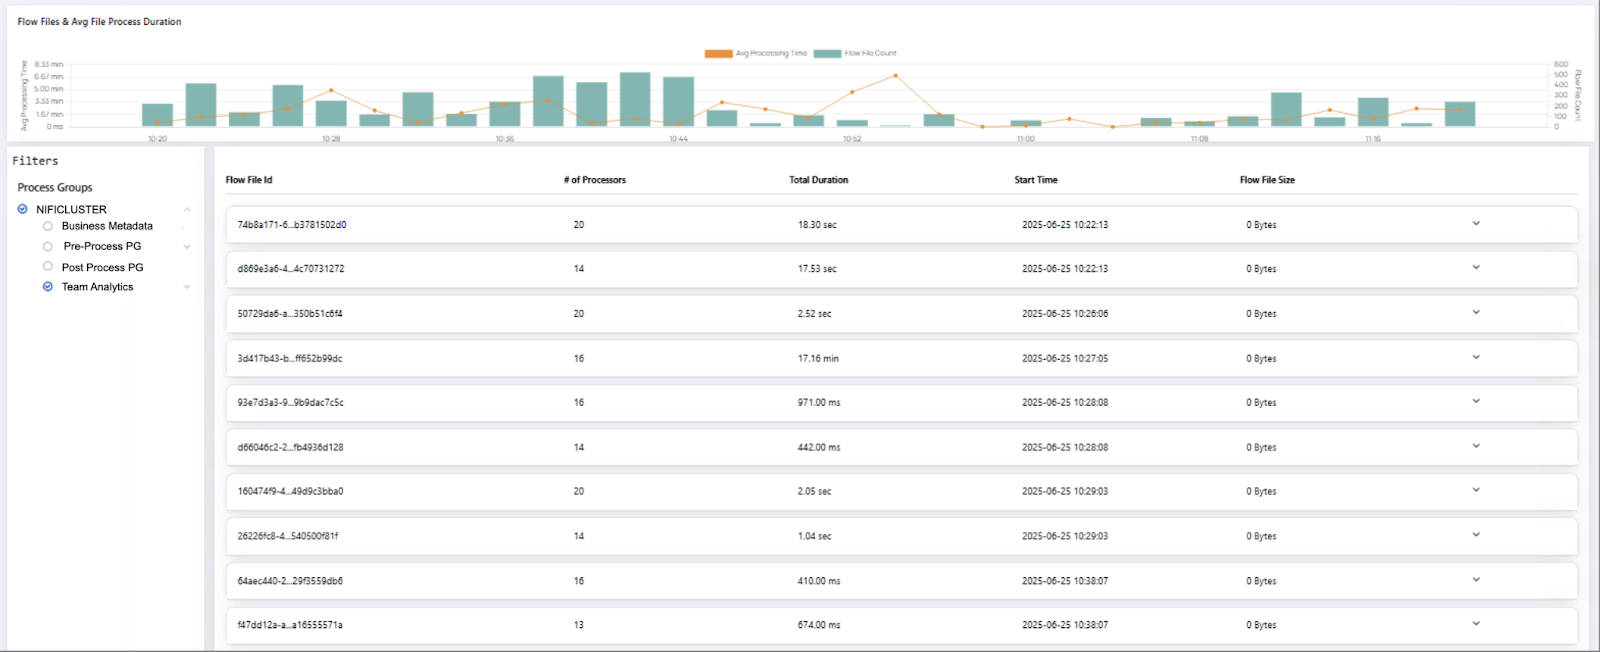
4. Flow File Analysis
Track how flow files move through your system:
- Total flow file counts and processing durations
- Searchable by attributes (e.g., filename, flow ID)
- Inspect metadata like file size and processor lineage
This is essential for tracing delays or investigating failures in complex pipelines.
Reference Docs: Acceldata Pulse Nifi
Built-in & Custom Alerts: Stay Ahead of Failures
Pulse doesn’t just show you what's happening—it tells you when something’s wrong, through a robust alerting engine.
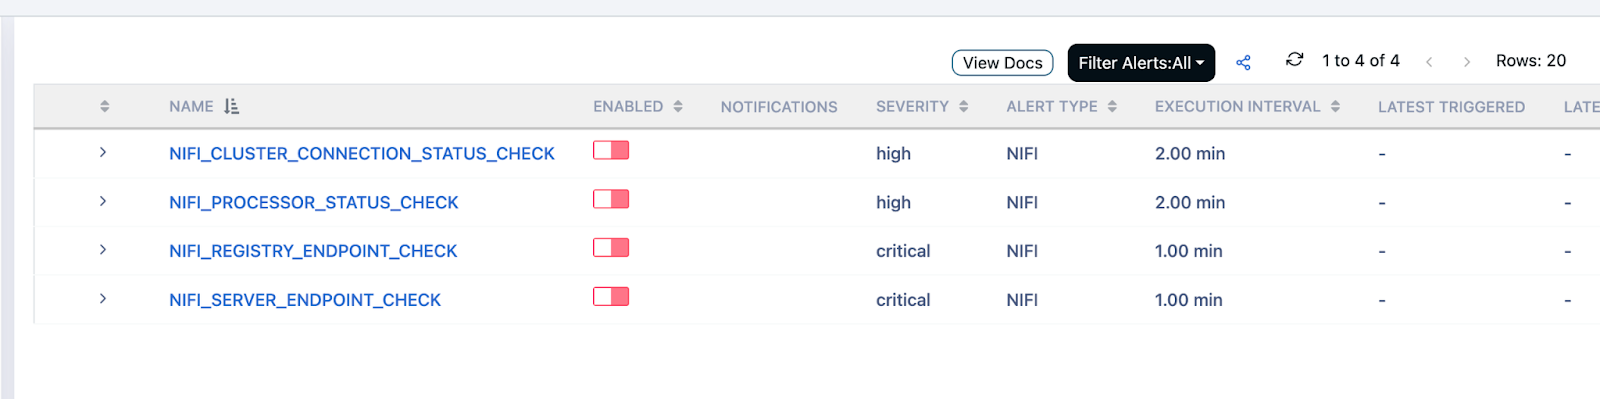
1. Built-in Alerts
These out-of-the-box alerts monitor core NiFi services:
- NIFI_CLUSTER_CONNECTION_STATUS_CHECK
Triggers when a NiFi node is disconnected from the cluster. - NIFI_PROCESSOR_STATUS_CHECK
Notifies if any processor is not in the "Running" state. - NIFI_SERVER_ENDPOINT_CHECK
Verifies if the NiFi server endpoint is alive and responsive.
2. Custom Alerts
Platform teams can define custom alerts based on operational thresholds, log patterns, and pipeline behaviours. Below are a few examples, but Pulse supports a wide range of customizable conditions depending on your monitoring needs:
- JVM Metrics Alert
Trigger when heap usage crosses a critical threshold—ideal for preempting memory-related slowdowns. - Error Log Detection
Alert when specific error patterns appear in NiFi logs, enabling quick remediation of processor or system issues. - Process Group Flow Alerts
Monitor for abnormal flow conditions like queued files, backpressure activation, or blocked processors.
By combining these insights and alerts, Pulse empowers platform teams to ensure high availability, performance stability, and rapid recovery, regardless of the size or complexity of the NiFi deployment.
Reference Link: Creating Alerts in Acceldata Pulse
How Application Teams Can Monitor NiFi Dataflows with Pulse
While platform teams oversee the infrastructure, application teams need deep visibility into specific dataflows—especially the flows they own and operate. With Acceldata Pulse, they can build customised dashboards and alerts tailored to the performance, reliability, and SLA.
1. Custom Dashboards: Flow-Level Monitoring Made Easy
Pulse allows application teams to zoom into specific process groups, processors, or connections, giving them a real-time, contextual view of how their data is moving.
With these dashboards, teams can:
- Track how much data is processed by a given processor or group
- Visualise throughput trends, processing times, and failure rates
- Monitor connection queue stats to detect bottlenecks
- Assess whether SLA targets are being met for time-sensitive pipelines
This flow-specific visibility is especially valuable for debugging, performance tuning, and release validation.
Reference Link: Acceldata Pulse Dashplots and Visualizations
2. Custom Alerts: Get Notified When It Matters
Application teams can configure targeted alerts to catch issues before they break SLAs or affect downstream systems.
Example Use Cases for Custom Alerts:
- High Data Volume Alert
Trigger when a process group or processor handles significantly more data than expected—useful for detecting spikes or anomalies. - Backpressure Warning
Alert when backpressure is triggered on a connection, indicating downstream congestion. - Queued FlowFiles (Count/Size)
Monitor for buildup in queues—either by number of flow files or total byte size. - Processor Inactivity Alert
Detect if a key processor has been inactive for too long, potentially indicating a blocked source or misconfigured route.
By leveraging these custom monitoring capabilities, application teams can:
- Ensure data pipelines are flowing smoothly
- Proactively respond to SLA violations
- Collaborate more effectively with platform teams
Ultimately, this shared observability model bridges infrastructure and application concerns, giving each team the insights they need, without stepping on each other's toes.
Reference Link: Creating Alerts in Acceldata Pulse
The Bigger Picture: NiFi in a Data Platform
When NiFi is part of a larger ecosystem (Kafka, HDFS, cloud storage, databases), monitoring becomes even more important. You need to:
- Correlate NiFi performance with upstream/downstream system health
- Analyse bottlenecks across services
- Trace a flow file from ingestion to delivery across multiple systems
Good observability isn't about throwing a bunch of tools into the mix. It's about:
- Setting alert thresholds aligned to business SLAs
- Building dashboards that speak to both ops and developers
- Creating a feedback loop between flow behaviour and platform tuning
- Using anomaly detection to catch subtle drift before major failure
Monitoring NiFi isn’t just a best practice—it’s a necessity. Whether you're responsible for uptime or data delivery, Acceldata Pulse helps teams see problems before they escalate. The result? Better SLAs, fewer surprises, and more time spent building rather than firefighting.
Ready to monitor smarter? Start with Acceldata Pulse.


