


.svg)


Introduction
Managing a Hadoop environment at scale is no small feat. Data teams must juggle complex distributed systems (HDFS, YARN, Hive, Spark, Impala, etc.) while meeting strict SLAs for data processing and analytics.
In traditional setups, issues often come to light only after they’ve caused slowdowns or failures, making troubleshooting reactive and painful. What if you could catch and fix problems before they spiral out of control?
Acceldata Pulse makes this possible by providing intelligent, proactive monitoring coupled with automated remediation. In this post, we explore how Acceldata Pulse’s smart alerts and automated actions help Hadoop administrators prevent unpleasant – even catastrophic – failures and keep their clusters running optimally.
By taking a preemptive approach, data engineers and platform admins can ensure their Hadoop operations meet BI SLAs and performance goals with confidence.
Key Features of Acceldata Pulse for Hadoop Operations
1. Intelligent In-Flight Alerting
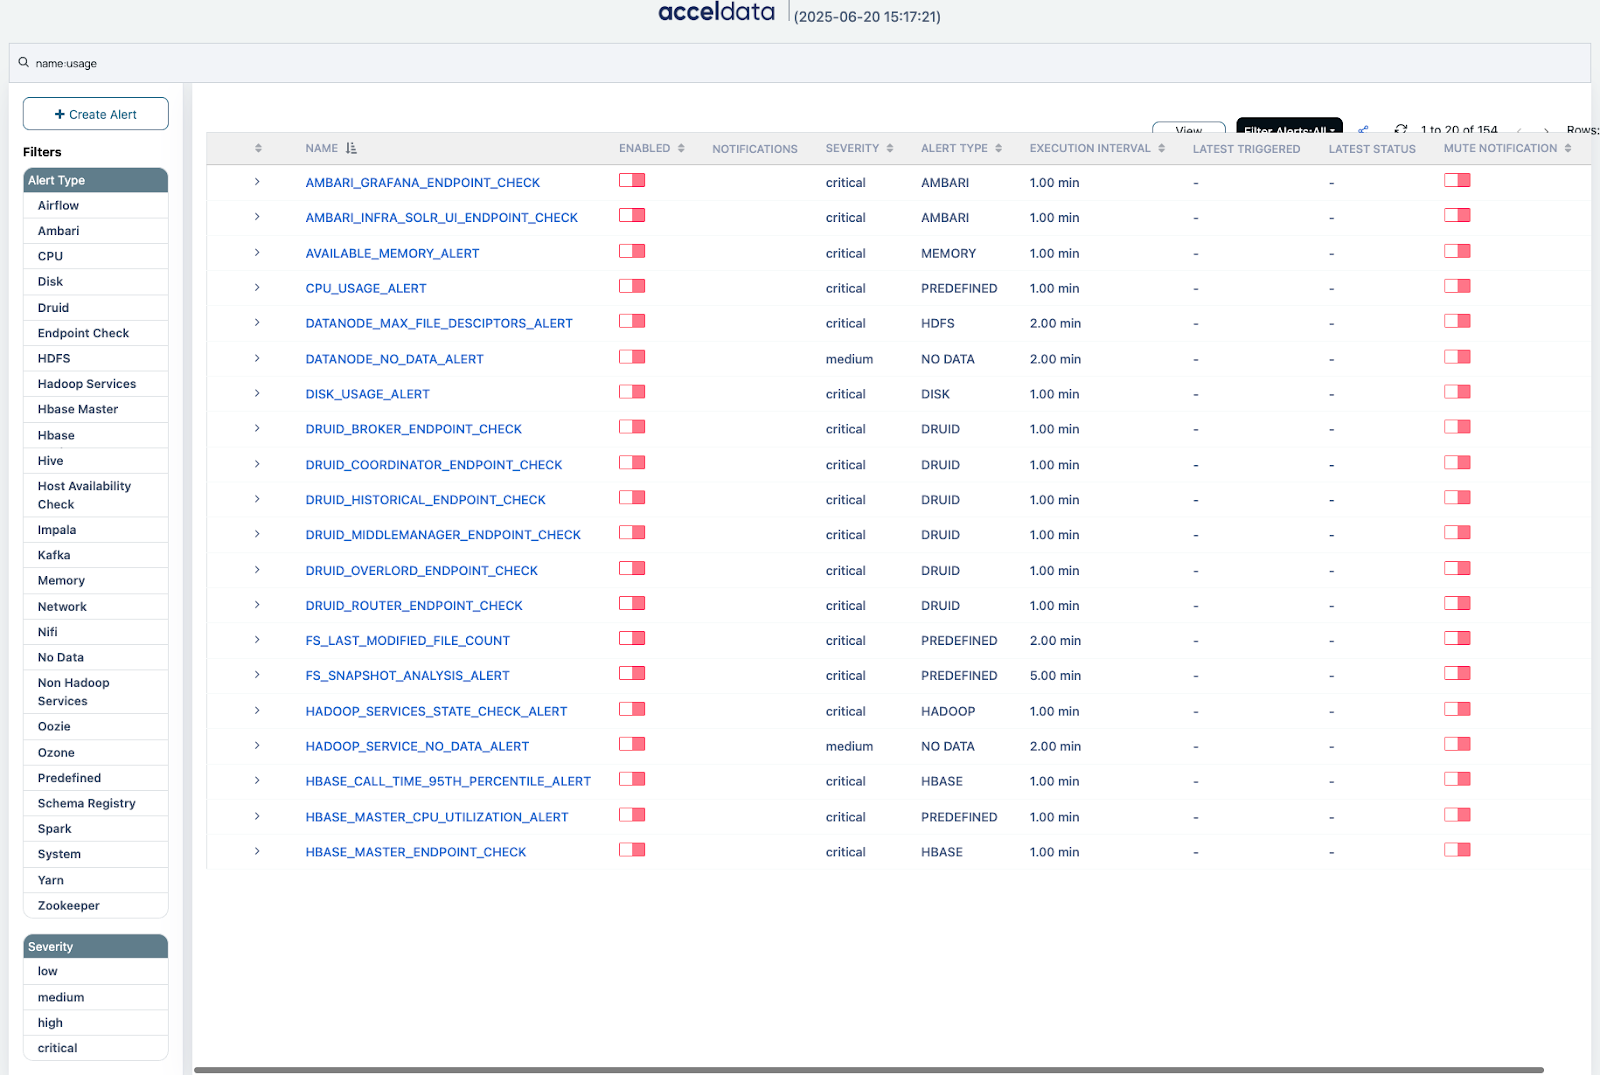
Acceldata Pulse’s alerting system is built to detect issues in real time, even while jobs and queries are still running. Unlike after-the-fact alerts, this in-flight monitoring gives administrators precious lead time to respond before users are impacted. Pulse correlates a wealth of operational data to surface anomalies early. It exposes all important Hadoop metrics in a Pulse UI for creating alert rules.
You can define complex conditions – even combining multiple metrics with mathematical functions – to precisely target the conditions you care about. For example, you might set a rule to flag a Hive query whose runtime and memory usage both exceed certain thresholds.
Pulse’s ability to filter alerts (e.g. ignore non-critical jobs) ensures you’re only notified about meaningful issues. The result is an early-warning system that helps proactively limit risk, rather than simply report damage after the fact.
2. Predefined “Stock” Alerts
To make life even easier, Pulse comes with a rich library of out-of-the-box alerts for common Hadoop pain points. These stock alerts cover scenarios that many Hadoop operators will recognize.
For instance, Pulse includes a predefined alert for long-running YARN applications (YARN_LONG_RUNNING_JOB) that automatically triggers if a job exceeds a high duration threshold.
There’s also a predefined alert for excessive pending YARN jobs (YARN_PENDING_JOBS_COUNT), which fires if more than a set number of jobs are stuck waiting in the queue, a telltale sign that a YARN queue is maxed out.
Another alert compares the current pending job count to historical levels (YARN_PENDING_APPS_COMPARISON) to catch anomalous spikes in queue backlog.
In addition, Pulse provides stock alerts for other ecosystem components (e.g,. HBase region status changes, Kafka broker issues, etc.) so you get broad coverage from day one.
These predefined rules reflect best practices and hard-won operational knowledge, allowing teams to deploy Pulse and immediately monitor critical Hadoop metrics without extensive setup.
3. Comprehensive, Correlated Monitoring
Pulse doesn’t limit you to just a few metrics or siloed views – it offers full-stack observability across your Hadoop cluster. You can monitor everything from low-level infrastructure stats (CPU, disk, network) up to platform metrics for YARN, HDFS, Hive, Spark, Impala, Kafka, and more.
This cross-sectional insight means alerts can be correlated across components. For example, a single alert can be configured to consider HDFS utilization together with YARN latency or Hive query performance.
The platform sends advanced notifications for innumerable conditions that might affect your data pipelines, such as a lack of capacity on a YARN queue or an ever-growing number of small files on HDFS.
By monitoring such patterns, Pulse helps admins catch systemic issues (like resource saturation or data skew) early. Pulse also provides incident reports out-of-the-box – every triggered alert (termed an “incident”) is logged with context for post-mortem analysis and verification of improvements.
This holistic observability ensures nothing falls through the cracks and that alerts are actionable, not just noise.
4. Seamless Integration and Notification
Acceldata Pulse is designed to fit into enterprise workflows. Alerts can be delivered across various channels – email, Slack, or even tools like PagerDuty and ServiceNow – to make sure the right people are notified immediately. (Recent updates added support for Telegram and LINE messaging as well).
The alerting interface is a self-service, one-stop shop accessible via a web UI, so platform engineers can define or tune alert rules on their own without manual configuration on each Hadoop service.
Your team has a consistent way to create alerts, whether it’s for infrastructure, applications, etc. In short, Pulse streamlines the process of monitoring a complex Hadoop environment by centralizing and simplifying how alerts are defined and consumed.
Real-World Examples of Proactive Alerts with Built-In Actions Support
To illustrate how intelligent alerts and automation come together in practice, let’s walk through a few common Hadoop operational challenges and see how Acceldata Pulse addresses them:
1. YARN Queue Capacity Management
In busy multi-tenant Hadoop clusters, it’s easy for certain YARN queues (capacity pools) to become overloaded. When a queue runs out of resources, jobs start piling up in the pending state, degrading SLA performance for that business unit.
Pulse can detect this scenario early using its stock alerts – for example, by raising an incident if the number of pending YARN applications exceeds, say, 15 jobs.
This warns the admin that a queue is starved for resources. More impressively, Pulse can automate a response. Alternatively, an automated policy could move less critical jobs to a different queue.
In essence, Pulse enables a form of auto-balancing for YARN workloads. The system not only alerts you to the looming resource crunch, but it can also execute pre-planned steps to relieve the pressure.
The end result is that your important Hadoop jobs keep running smoothly, and end-users are unaffected by what would have been a queue meltdown.
2. Long-Running Job Detection and Remediation
Another common challenge is identifying jobs that run far longer than expected, whether due to inefficient code, bugs, or hung processes. Every Hadoop admin has seen a runaway job, such as a MapReduce or Spark application that keeps running far beyond normal durations, consuming massive resources and potentially blocking time-sensitive reports.
Acceldata Pulse’s stock alert library directly addresses this with alerts like YARN_LONG_RUNNING_JOB, designed to detect any YARN application exceeding a specified runtime threshold and raising a critical alarm when a job surpasses the normal expected duration.
For example, an admin might set this threshold to 2 hours for batch jobs—if any MapReduce or Spark application runs beyond 2 hours, Pulse will immediately flag it.
Pulse also offers refined alert variants like
YARN_LONG_RUNNING_JOB_WITH_FILTERS, which targets long jobs with specific characteristics (such as certain users or applications), and
YARN_LONG_RUNNING_JOB_QUEUE, which focuses on jobs exceeding thresholds within particular queues. These options help zero in on problematic jobs within the context of your scheduling policies, eliminating the need for administrators to manually hunt for “stuck” jobs.
Beyond detection, Pulse provides automated remediation actions. When a long-running job alert is triggered, Pulse can automatically terminate the offending application once it crosses the set time or resource threshold.
This immediate kill action prevents the job from hogging cluster resources indefinitely, keeping the cluster from getting stuck and ensuring SLA deadlines aren’t missed due to a rogue process.
You can configure alerts so that “if a Spark job is not completed within the stipulated time, [Pulse] triggers an alarm,” allowing teams to investigate or terminate the job early, saving hours of wasted cluster time and preventing wider issues.
3. Preventing Backlogs and Wasted Resources
Pulse stock alerts also help catch conditions that indicate broader inefficiencies. For example, the YARN_PENDING_JOBS_COUNT alert will fire if the number of YARN jobs in pending (waiting) state exceeds 15 (by default) – a sign that your cluster may be under-resourced or a queue is oversaturated.
There’s even a more nuanced YARN_PENDING_APPS_COMPARISON alert, which compares the current pending-job count to a previous time window; if the growth in pending jobs is abnormally high (beyond a percentage threshold), it triggers an alert.
This kind of trend-based alert is extremely useful in spotting sudden spikes in workload demand or scheduler slowdowns.
By using these out-of-the-box rules, platform engineers gain insight not just into failures, but into emerging performance bottlenecks – for instance, noticing that jobs are queuing up faster than usual could prompt capacity tuning or investigating resource manager issues.
Pulse also covers many other Hadoop facets: from HDFS storage utilization and under-replicated blocks, to Hive/Impala query failures, to Kafka broker health. All stock alerts can be customized as needed, but even in default form, they encode Acceldata’s extensive Hadoop expertise.
The result is that Pulse can act as a 24x7 sentry, constantly monitoring your Hadoop stack for the tell-tale signs of trouble and inefficiency, often surfacing insights that might be missed in manual monitoring.
4. Uncovering Hidden System-Level Failures with High-Fidelity Metrics
Pulse detects rare but high-impact conditions—like Hive file-handle leaks or NameNode RPC floods—that traditional monitoring tools often miss.
These nuanced failure modes can silently degrade system performance or cause cascading service impacts if not caught early. Pulse’s expanded metrics library offers deep visibility into such scenarios:
- Hive and Impala Resource Leak Detection
- HIVE_OPEN_FILES_EXCEEDED: Detects when a HiveServer2 instance exceeds safe file-handle thresholds (e.g., >1,000 open files per node), which can lead to service crashes due to “Too many open files” errors.
- IMPALA_OPEN_CONNECTIONS_PER_COORDINATOR: Alerts when Impala coordinators exceed healthy connection limits (e.g., >500 active connections), flagging issues such as thread leaks, idle client connections, or improperly closed sessions.
- HIVE_OPEN_FILES_EXCEEDED: Detects when a HiveServer2 instance exceeds safe file-handle thresholds (e.g., >1,000 open files per node), which can lead to service crashes due to “Too many open files” errors.
- HDFS NameNode Throttling and Latency Monitoring
- NN_GET_FILE_INFO_RATE: Flags excessive metadata lookup activity (e.g., >10,000 getFileInfo calls/sec), typically triggered by misconfigured jobs or small-file storms that can overwhelm the NameNode.
- NN_HIGH_RPC_QUEUE_TIME: Detects elevated RPC latency (e.g., >500ms), a leading indicator of NameNode saturation that often precedes user-facing slowdowns or cluster instability.
- NN_GET_FILE_INFO_RATE: Flags excessive metadata lookup activity (e.g., >10,000 getFileInfo calls/sec), typically triggered by misconfigured jobs or small-file storms that can overwhelm the NameNode.
Side note
The flexibility of Pulse’s rules means these examples are just the beginning. You could create alerts for virtually any scenario for which metrics are available and pair with Automated Pulse Actions.
The platform’s advanced alerting can surface issues ranging from missing data to hardware failures, and its action framework can tie into any scriptable remedy. This combination gives your data operations an adaptable, self-healing quality.
Automated Pulse Actions Framework
Intelligent alerts are only half of the equation – the real game-changer is Pulse’s automated actions framework, which closes the loop by responding to incidents in real time.
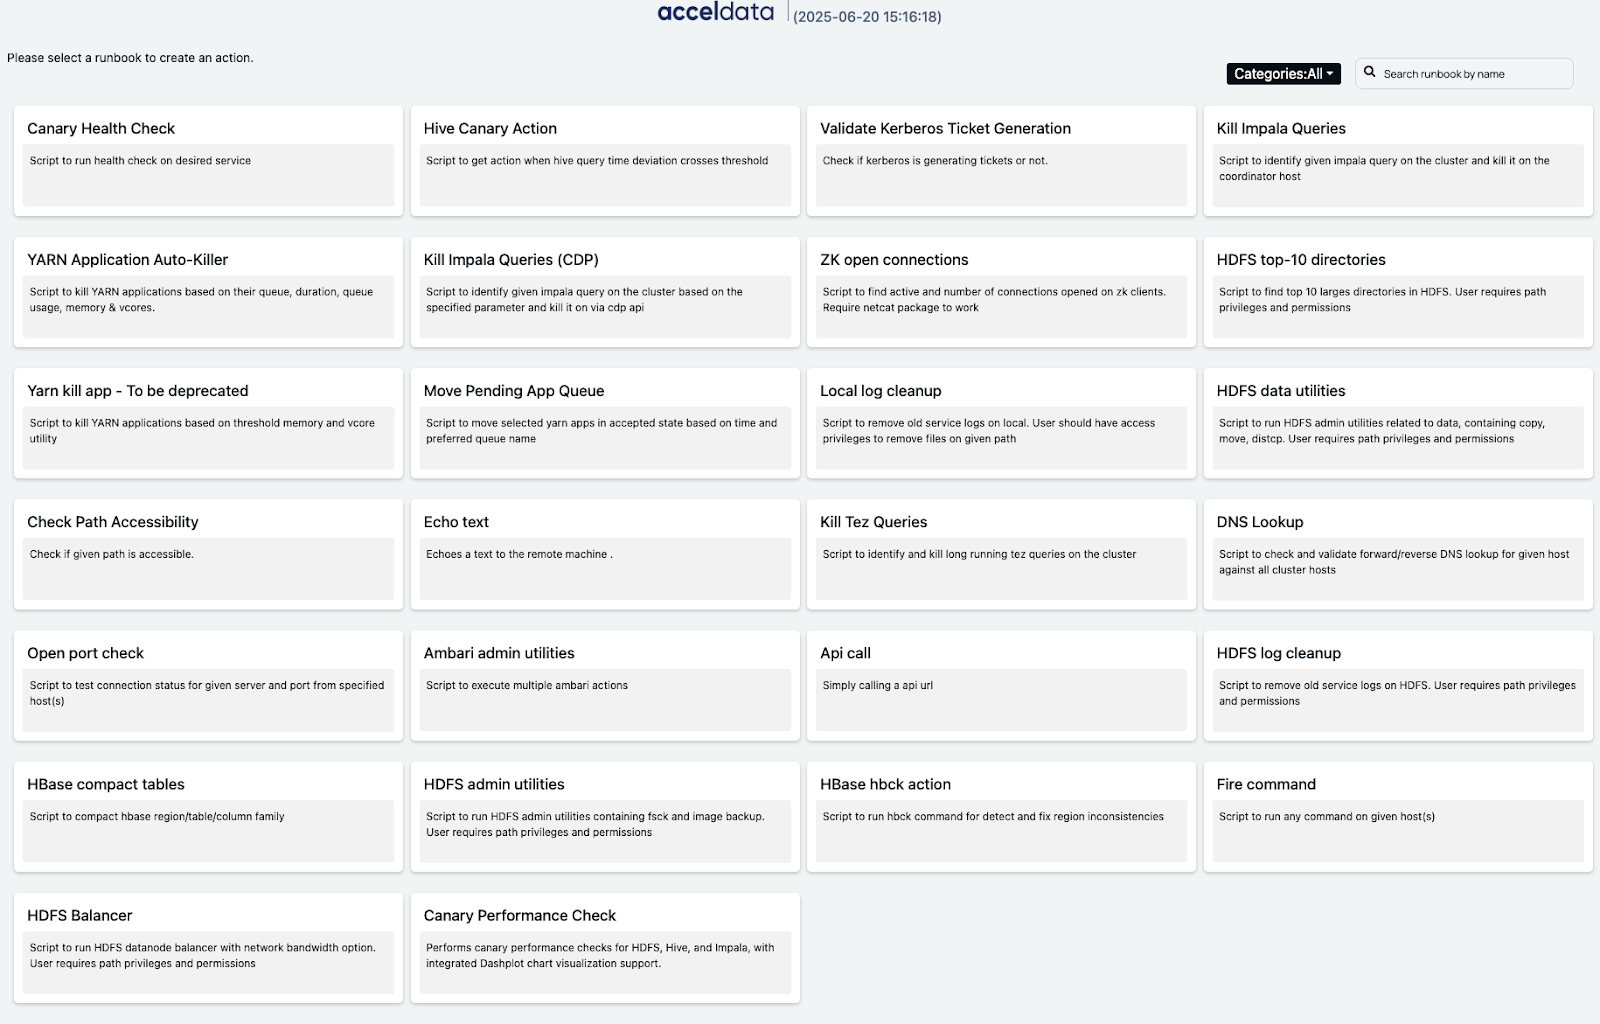
Pulse’s action framework is essentially an extensible workflow engine for Hadoop operations. Administrators can attach one or more actions to any alert definition.
When the alert condition triggers, Pulse will not only create an incident notification, but also immediately execute the associated action(s) – no human intervention needed.
Actions in Pulse can be configured in a point-and-click interface as part of the alert settings, making it straightforward to set up automation as you create alert rules.
Crucially, Acceldata provides several actions out of the box to cover common remediation steps. As we saw, killing a YARN application or changing its priority can be done automatically.
There are also built-in runbooks for routine admin tasks – for example, Like HDFS balancer action that can be scheduled to run when data skew is detected. Another out-of-box runbook checks Hive query response times (a “Hive canary” test) daily and triggers a notification if the times exceed a threshold.
These packaged actions allow teams to automate their operational playbooks with minimal effort.
Beyond the built-ins, the true power is that Pulse’s actions are fully customizable. The framework can invoke arbitrary shell or Python scripts as part of an action workflow.
This means anything you can script – whether it’s calling an API, running a Linux admin command, or executing a custom Hadoop CLI operation – can be integrated into Pulse’s automated response.
Pulse even allows integration with your organization’s existing runbooks and workflows. So you can trigger external systems (like opening a ticket or paging a team) if desired.
In essence, Pulse’s automation is not limited to the Hadoop cluster itself; it can reach out and orchestrate steps across your environment as needed.
All these actions are executed in a controlled manner and logged as part of the incident, so you maintain full visibility into what was done.
By leveraging the automated actions framework, Hadoop administrators can achieve a level of hands-off operation that significantly reduces mean-time-to-recovery.
Simple problems get fixed immediately, and complex issues at least get a first-response action applied, often mitigating impact until an engineer can follow up.
This shifts the ops model from reactive firefighting to proactive control – a foundational concept in the emerging DataOps and autonomic computing practices. Its a unique feature of Pulse’s alerting is the ability to tie in “auto-corrective pre-configured workflows” as responses.
In other words, Pulse doesn’t just raise red flags; it also wields the tools to automatically turn things around when those flags go up.
To highlight the flexibility, the Pulse UI allows you to graphically design action workflows with triggers and steps. For example, you might configure a workflow that says “If Alert X fires more than 3 times in an hour, then perform Action Y and escalate to Team Z.”
One such workflow (illustrated in the Pulse interface) kills any YARN application spawning over 25 mapper tasks – a safeguard against inefficient jobs with extreme parallelism.
Another might be scheduled (time-based) rather than event-based, such as running a cleanup script every midnight if certain conditions were true during the day. This blend of rule-based triggers and automation gives Pulse the ability to act as a self-healing system for your Hadoop environment.
It’s like having an autopilot for cluster operations: if something starts to go wrong, you know Pulse is watching and ready to respond immediately.
Benefits of Proactive Monitoring and Automation
Adopting intelligent alerts and automated actions for Hadoop operations yields significant benefits:
1. Prevent Failures and Downtime
By catching anomalies early and taking corrective action, you dramatically reduce the likelihood of major incidents. Many issues are resolved before users even notice, thanks to real-time, self-healing automation. This leads to a more stable Hadoop platform with far fewer fire drills.
2. Meet SLAs with Confidence
Proactive alerting and enforcement of SLAs mean you can reliably hit your batch processing deadlines and interactive query performance targets.
Pulse’s in-flight alerts and actions ensure that a slow Hive query or stuck Spark job won’t silently derail your data pipeline.
With automated SLA enforcement, Hadoop admins and data engineers can sleep easier knowing that critical jobs will complete on time (or be intelligently handled if not). These strategies, combined with self-service analytics, allow Hadoop interactive BI workloads to be managed confidently for end-users– no more unpleasant surprises on Monday morning!
3. Optimize Resource Utilization
Automated actions help reclaim wasted resources and keep the cluster efficient. By killing runaway processes, adjusting job priorities, and adding capacity only when needed, Pulse prevents resource hogs from monopolizing the cluster.
Idle or under-utilized resources can be put to work safely (as seen with features like the YARN memory optimizer).
Overall, your Hadoop infrastructure delivers more bang for the buck. The system can even recommend or execute rebalancing actions (for HDFS, Kafka, etc.) so that hardware is used evenly.
This optimization not only cuts costs (some users see 20–30% improvements in utilization) but also improves performance for everyone.
4. Reduce Manual Intervention and Alert Fatigue
A huge advantage of Pulse’s approach is the workload it takes off human operators. Routine issues are handled automatically, so the ops team isn’t constantly reacting to pages for things that a script could fix.
When Pulse does notify engineers, it’s usually for complex issues that truly need attention, not every minor threshold breach, which greatly reduces alert fatigue.
Our advanced alerting lets cluster admins quickly guide the system back to a normal state, or even let the Automated Actions Framework do it for them.
Engineers can focus on improving the data platform rather than fighting fires 24/7. This also helps bridge skill gaps: even less experienced team members can rely on well-defined automated runbooks to handle incidents correctly, following best practices every time.
5. Improved User and Business Productivity
Ultimately, better reliability and performance of the Hadoop environment translates to happier end-users, whether they are data analysts running BI queries or downstream applications relying on timely data.
When the platform is consistently meeting SLAs and recovering quickly from hiccups, stakeholders develop greater trust in the data infrastructure.
Projects aren’t delayed by cluster issues, and business teams can make decisions on fresh data with confidence.
The proactive stance enabled by Pulse means the data platform becomes an enabler for the business, not a bottleneck.
Furthermore, the insights gained from Pulse’s monitoring (like detailed incident reports and trend analyses) can drive continuous improvement, helping you tune workloads and configurations to prevent future issues.
Conclusion
In the ever-evolving world of big data, Hadoop operations need more than basic monitoring – they need intelligence and automation at their core. Acceldata Pulse brings exactly that, by fusing real-time observability with actionable automation.
The platform’s intelligent alerts anticipate problems across the Hadoop stack, and its automated actions respond instantly to keep systems running smoothly.
This powerful combination boosts cluster performance, stability, and efficiency, allowing data teams to deliver on SLAs with far less stress.
By implementing Pulse’s proactive alerting and self-healing workflows, organizations can transform their Hadoop environment into a resilient, autopilot-run system. Data engineers and platform admins regain control over their time, focusing on innovation and optimization rather than constant firefighting.
The Hadoop ecosystem – from YARN resource managers to Hive query engines – benefits from always-on guardians that watch for issues and fix them in real time.
The end result is a Hadoop operation that is significantly more robust and agile, capable of adapting to issues on the fly and scaling to meet demand without sacrificing reliability.
For teams looking to modernize their Hadoop operations, Acceldata Pulse provides a proven path forward. Proactive monitoring and automated actions are no longer nice-to-haves – they are becoming essential for managing data platforms at scale. With tools like Pulse, you can confidently meet your data SLAs, optimize your resource usage, and ensure that your big data platform remains an asset rather than a liability.
In short, intelligent alerts and automation turn Hadoop from a wild beast that must be tamed into a well-oiled machine that powers your business. Embracing this approach will undoubtedly elevate your Hadoop operations to new heights.
(Interested in seeing these capabilities in action? Consider getting a hands-on demo of Acceldata’s Data Observability Platform to watch how quickly you can set up custom alerts and automated actions for your own Hadoop workflows. The era of reactive Hadoop management is over – with Acceldata Pulse, you can confidently move into a future of proactive, intelligent data operations.)
Make your Hadoop cluster work harder, not costlier. See how it’s done!


