


.svg)


Cloud data platforms like Snowflake or Databricks are becoming increasingly popular for organizations looking to handle large-scale data workloads. They provide a powerful and flexible platform that can handle millions of queries or data jobs and can be used to process, analyze, and manage large data sets. Data teams are seeking new and better ways to manage and optimize those queries.
These workloads are of different types depending upon the organization’s use cases, which might include Customer Segmentation and Personalization, Fraud Detection, Predictive Maintenance, Supply Chain Optimization, Financial Planning and Analysis, Human Resources Analytics, Risk Management, Marketing Analysis, and others. The workloads can be categorized into the following categories:
- Batch ETL (Extract, Transform, Load): This type of workload involves extracting large amounts of data from a variety of sources, transforming it into a format that can be used for analysis, and loading it into a data warehouse or other storage system. This process is typically run on a regular schedule that usually runs daily or weekly.
- Exploratory: This type of workload involves using data to discover new insights and patterns. It is typically done by analysts or data scientists using tools such as SQL or R.
- Interactive: This type of workload involves using data to answer specific questions or make decisions in real-time. It is typically done by business users using tools such as dashboards or reports.
Why You Should Optimize Queries
Badly written queries can significantly increase costs on cloud data platforms for a number of reasons. One reason is that poorly optimized queries can need a larger cluster or warehouses for execution, which can result in higher costs. Additionally, bad queries can also increase the amount of data to be scanned or processed, which can result in higher costs because the queries take longer time to complete.
Bad queries can increase costs, which results from the number of queries that are sent to the platform. For example, a poorly designed application that sends a large number of unnecessary queries can increase costs due to the increased number of query operations.
To prevent these issues, it is essential to optimize queries and minimize the number of unnecessary queries sent to the platform. This can be done by using indexing, caching, and other techniques to improve query performance. Additionally, monitoring tools can be used to identify and troubleshoot poorly performing queries, which can help reduce costs.
In general, bad queries can significantly increase costs (this is referred to as the “too much of a good thing", or “TMGT” effect) on cloud data platforms by consuming more resources, increasing the amount of data transferred, and increasing the number of queries sent to the platform.

To minimize these costs, it is important to optimize queries, minimize unnecessary queries, and use monitoring tools to troubleshoot poorly performing queries.
How to Use Guardrails to Optimize Queries
To protect against the inefficient one-off queries that are often executed as a part of exploratory workloads, data teams need to constantly monitor their compute resources using a feature like guardrails. While basic capabilities exist within cloud data platforms like Snowflake and Databricks, they are not mandatory and customers often ignore them. The Acceldata data observability platform provides alerts and flags when these guardrails are missing. The guardrails used in the data observability platform enable data teams to do the following:
- Ensure administration best practices are followed: This includes detecting and/or flagging violations, which Acceldata provides in our dashboards, alerts, and recommendations.
- Enforce best practices (take actions on limit violations): This is done in the Acceldata platform with features like resource monitors, cluster policies, statement timeouts, and other formats.
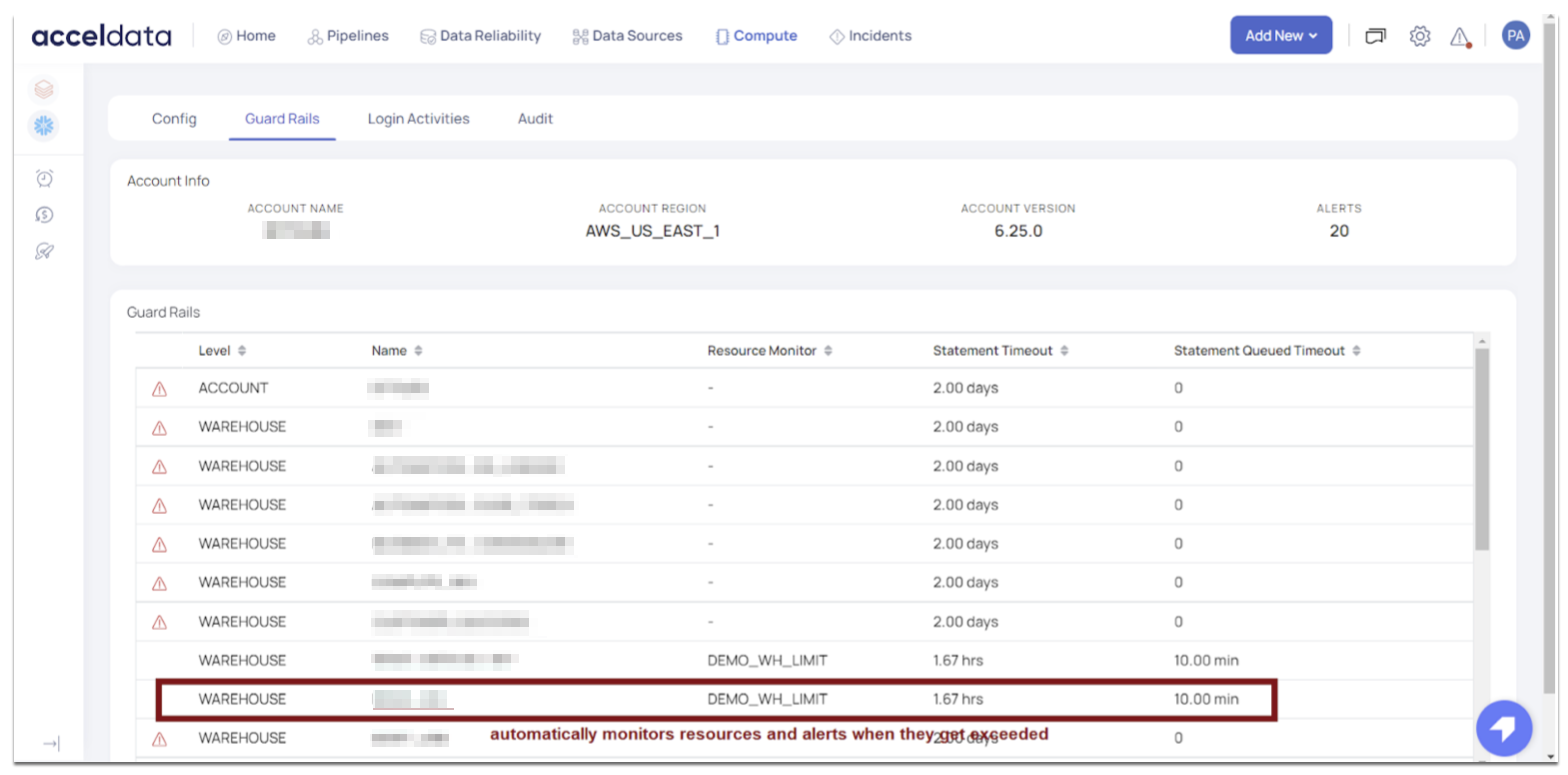
Without features like these in place, data teams risk allowing cloud data platforms to automatically scale up resources, which may result in unexpectedly high cloud bills.
Introducing Query Studio
The majority of workloads that are executed on data platforms are from repeatedly executing jobs or queries from scheduled ETL pipelines, interactive business intelligence (BI) tools, and other similar applications. These types of workloads are typically characterized by their repetitive nature, as they are executed on a scheduled basis, or in response to user interactions with the BI tools.
Since millions of jobs or queries get executed in a data platform, observability and management at the granular level of individual queries becomes extremely difficult. This is where methods such as query/job fingerprinting or other similar techniques come into play. These methods allow for similar queries or jobs to be grouped together, which makes it easier to perform analytics and gain insights into the performance of the data platform. Query fingerprinting, for example, is a technique that allows for the identification of similar queries by comparing the SQL statements and their parameters.
Once similar queries are grouped together, it becomes easier to analyze the performance of the group as a whole, rather than having to analyze each query individually. This can help to identify patterns and trends in the data, and can provide insights into areas where optimization is needed.
With the ability to group similar queries or jobs, it becomes possible to prioritize which workloads to optimize based on factors such as dominance or costs. For example, if a particular group of queries is responsible for a large portion of the overall resource usage, it may be more important to optimize those queries first.
Additionally, by providing aggregate metrics for the groups, it becomes possible to present the data in a more consumable or actionable manner, making it easier for stakeholders to understand and take action on the data.
The Acceldata data observability platform offers the Query Studio for Snowflake which provides benefits for data teams to understand, debug, and optimize queries and warehouses. The feature offers a wide range of features that can aid in the query process.
Similar to Acceldata’s data observability principle, it follows the measure-understand-optimize (MUO) cycle to improve the performance , efficiency, and cost of queries. It consists of three main steps:
Measure
The first step is to measure the performance and usage of the data platform and queries executing on the data platform.
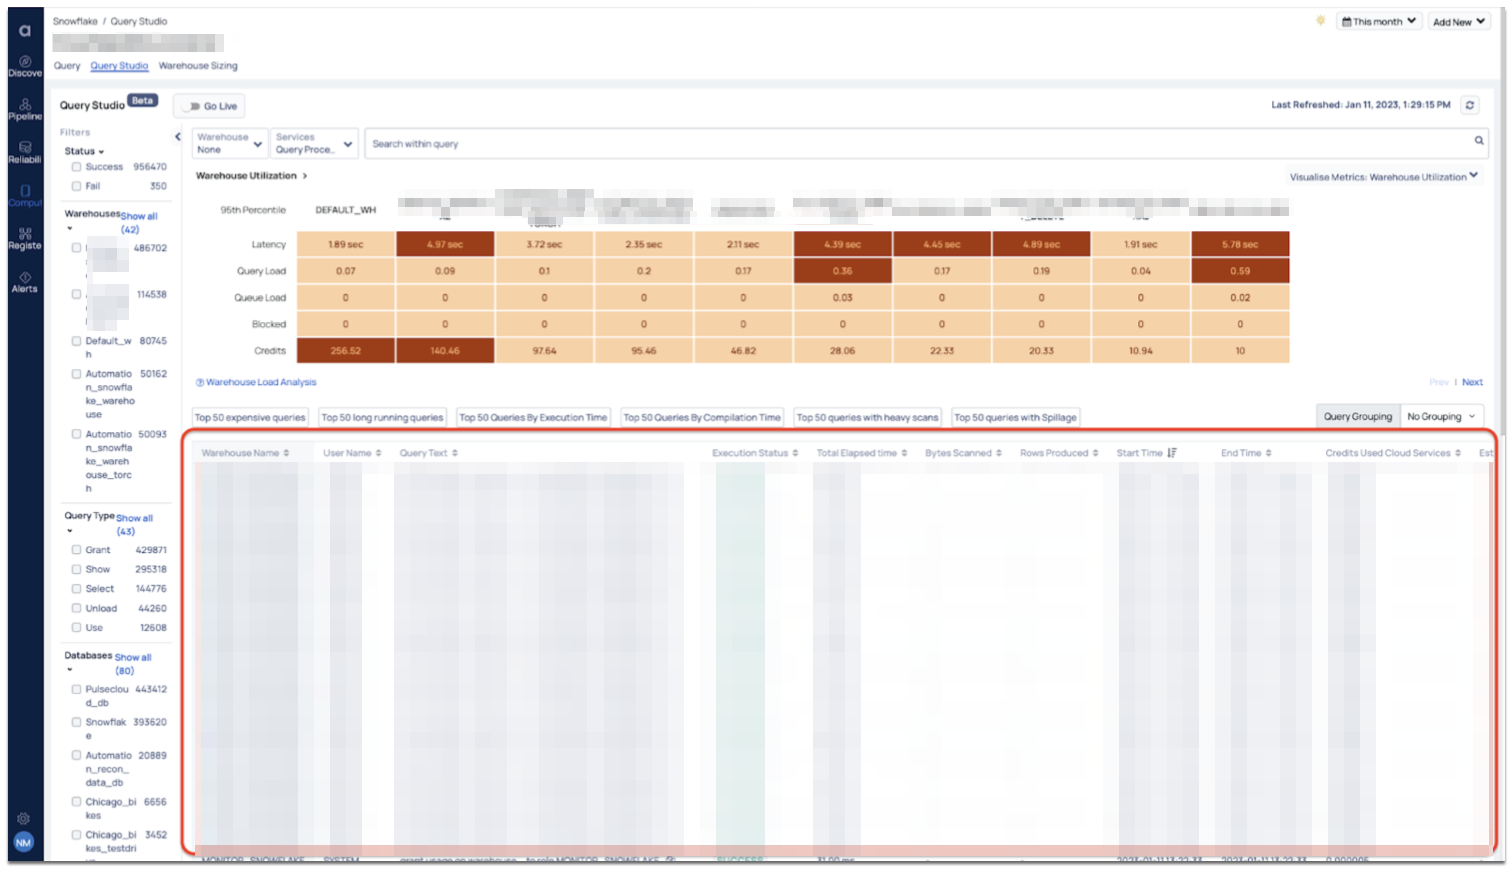
Having the capability to access detailed records of all queries executed in your Snowflake environment is immensely helpful when troubleshooting issues. Furthermore, analyzing these queries can reveal usage patterns among different warehouses and users, and highlight potential areas for improving the efficiency and cost-effectiveness of your Snowflake environment.
With the ability to execute thousands of queries in a given time period, having a filtering capability by status, warehouse name, query type, databases, and other categories can be extremely useful in narrowing the set of queries that need to be examined. Additionally, displaying the query count in front of the filter name allows users to easily understand the query set by different dimensions, making it a valuable tool for identifying potential issues.

As part of the optimization process, it's crucial for administrators and centers of excellence (CoE) to ensure that best practices are being followed and that queries are written efficiently. Identifying and addressing anomalous queries is a key aspect of this process. These filters make it easy to detect such anomalies and take appropriate action. Additionally, different metrics may be of interest for each filter, providing valuable insights for further optimization.
Understand
The second step is to understand the data that has been collected. This includes analyzing the data to identify patterns and trends, and to gain insights into the performance and usage of the queries. This step is critical to identifying areas where optimization is needed and to understanding the root cause of performance issues.

By utilizing the fingerprinting technique to group similar queries together, the user can gain insight into the execution frequency, cost, average latency, and schedule/frequency of the identified workloads within a selected interval. One can also observe the trend of the grouped queries at various metric levels such as execution time, number of rows produced, and costs. To simplify the process of debugging performance issues, query grouping allows the user to easily compare selected runs of grouped queries, along with all the associated metrics, for better understanding.
Optimize
The final step is to optimize the data platform based on the insights gained in the previous steps. This includes taking action to improve query performance, reduce resource usage, and minimize redundant data scanning costs, among other things. ADOC can provide a variety of recommendations for optimizing your queries and improving the performance of your cloud data platform.
By thoroughly analyzing query history metadata at the grouped query level, the software can suggest ways to improve warehouse sizing, identify and address unused large tables, high churn tables, and optimize table update clustering keys. It can also suggest ways to reduce external file listing time, optimize SQL queries, select only necessary columns and limit query results, apply filters before joining, avoid cartesian joins, and improve join performance by using unique keys, distinct keys, and clustering keys.
Additionally, the software can recommend ways to improve performance for high-frequency small DML operations, order by and group by operations, and suggest filters using the right equality, numbers, dates, short strings, data type match, and clustered columns.
A Framework for Continuous Query Optimization
Understanding the behavior of your queries and identifying performance bottlenecks is critical to maintaining the efficiency and stability of your cloud data platform.
By utilizing query fingerprinting and other observability features, you can gain a deeper understanding of your workloads and identify the most demanding queries. This, in turn, allows you to optimize your queries and improve performance, making your cloud data platform more reliable and cost-effective.
The ability to compare runs of grouped queries and associated metrics side by side, makes the process of troubleshooting and debugging performance issues much simpler.
By taking advantage of the query history metadata available on your cloud data platform, you can proactively identify and address performance issues, ensuring that your cloud data platform is always running at its best. This MUO (measure-understand-optimize) is a cyclic process that can be applied continuously, allowing constant monitoring and fine-tuning of the data platform.
Ready to optimize queries in your cloud environment? Get a demo of the Acceldata data observability platform to learn how to get started.
Photo by Idella Maeland on Unsplash


