


.svg)


.png)
Snowflake is undoubtedly one of the most popular cloud data platforms. In the second quarter of 2022, the company reported an 83% increase in year-over-year revenue growth. And users rave about how simple it is to use.
Snowflake’s biggest differentiator is its ability to automatically scale cloud infrastructure up or down based on your workloads. As a result, data teams that use Snowflake need not worry about scheduling workloads in a phased manner to avoid computing resource limitations.
But there’s a trade-off in using such a scalable data platform. Even small errors can snowball into thousands of dollars of unexpected Snowflake environment costs. To prevent such mistakes, data engineers and data teams need to constantly monitor their compute resources using a feature like the guardrails that are part of the Acceldata data observability platform. Among the many offerings provided by Acceldata are guardrails for resource monitors, statement_timeouts, and auto_suspend warehouse and more. While basic capabilities exist within Snowflake, they are not mandatory and customers often ignore them. Acceldata provides alerts and flags when these Snowflake-provided guardrails are not set.
What are Acceldata Guardrails?
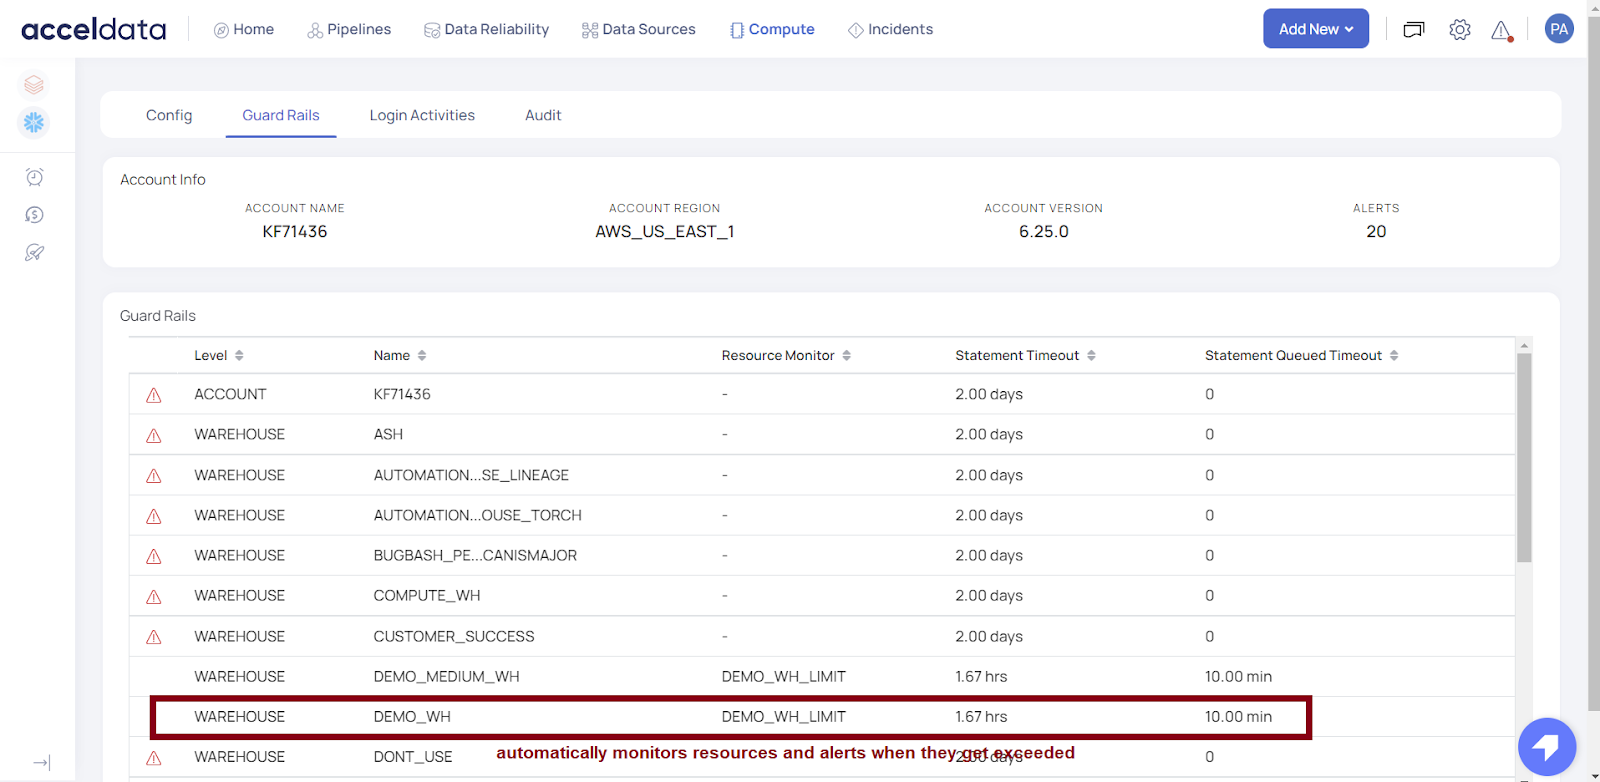
Guardrails is a resource monitoring feature that automatically alerts you when compute resources in your data environment exceed a pre-defined threshold. In a general sense, Acceldata’s guardrails for Snowflake enable data teams to do the following:
- Ensure Snowflake administration best practices are followed: This includes detecting and/or flagging violations, which Acceldata provides in our dashboards and alerts. Soon, our platform will also provide best practices recommendations.
- Enforce the best practices (take actions on limit violations): This is done in the Acceldata platform via Snowflake features like resource monitors, statement_timeouts, and other formats (you’ll see some of these outlined below).
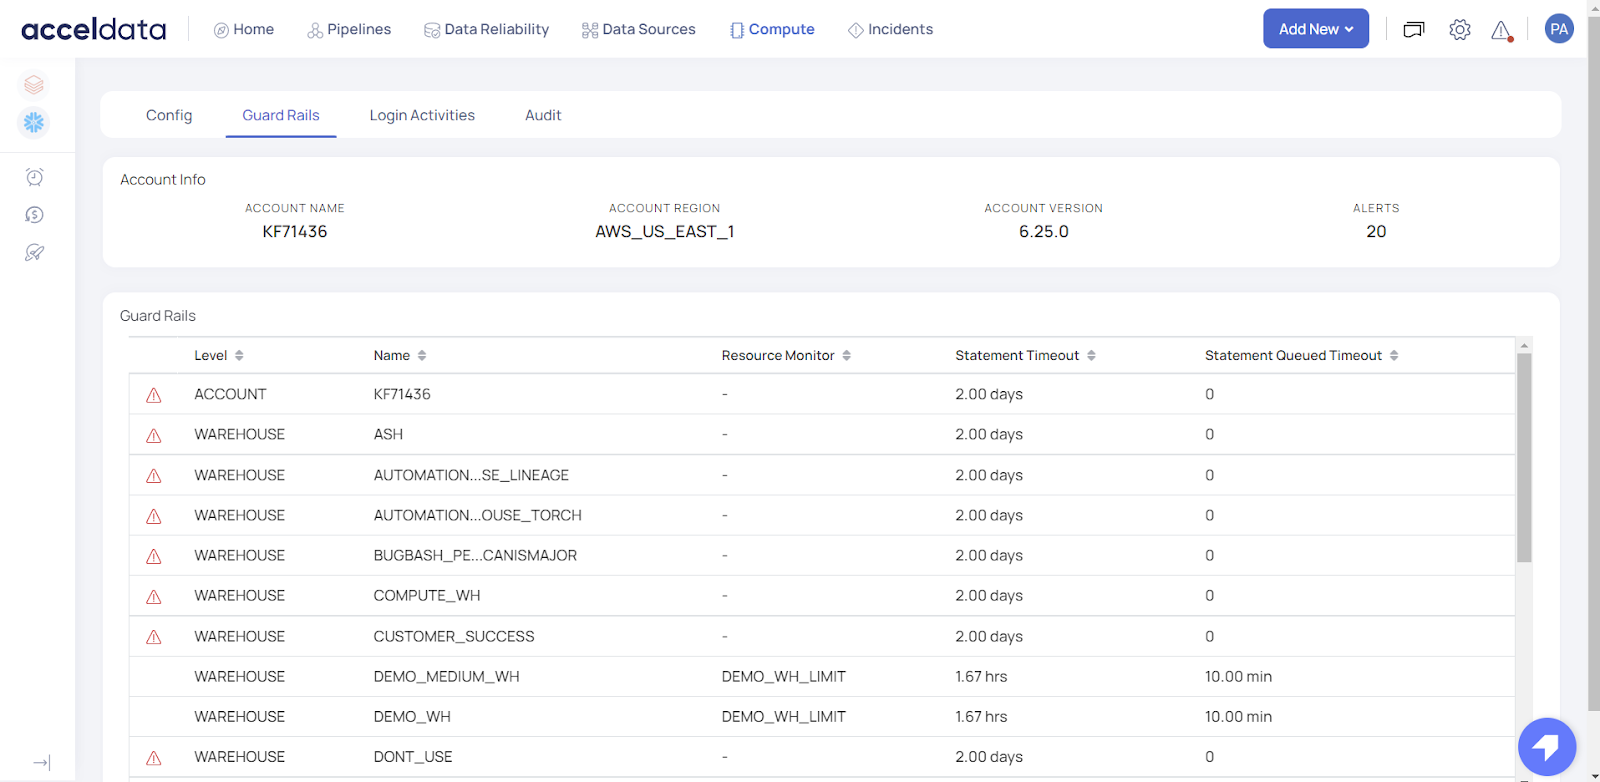
The next time that DEMO_WH data warehouse exceeds one or more of these resource limits, Acceldata’s guardrails will automatically send you an alert. You can also find more details about this alert under the Compute > GuardRails tab.
Without such a feature in place, data teams risk allowing Snowflake to automatically scale up resources, which may result in unexpectedly high cloud bills.
How Acceldata’s guardrails help you implement Snowflake best practices
Data teams realize the value of recommended best practices, but they don’t always follow through with the right actions. Acceldata’s guardrails use automatic resource alerts to nudge data teams toward implementing these best practices with the least amount of manual oversight or intervention.
For example, your team may realize the value of “setting appropriate timeout limits” to handle each workload. But an engineer may intend to increase the timeout limit for a particular resource-intensive query and forget to reset the limit back to the default timeout value. Such an error leaves room for unnecessary workloads to consume important computing resources and inflate your cloud bill.
To avoid such unexpected mistakes, consider creating dedicated virtual warehouses for each workload type. Your ETL/ ELT reporting and machine learning training data pipelines will each have one dedicated virtual warehouse. You can then use guardrails to monitor the different resource limits for each pipeline, depending on the workload. When a resource limit is exceeded, guardrails will automatically alert you to take corrective action. This way, you won’t have to rely on manual processes to implement best practices.
On a similar note, your team may intuitively understand the value of “purging dormant users” beyond a certain time period to lower the risks from unauthorized users. But in the heat of creating, managing, and troubleshooting data pipelines in your production environment, your engineers may forget to review the status of dormant users at the end of every week. This, in turn, may allow unwanted processes or users to consume important resources. GuardRails can automatically alert you to the fact that dormant users exist and guide you through the best practice of purging them.
This pie chart displays the number of dormant users, active users, and the percentage of dormant users in your Snowflake account. A dormant user is a user who has not logged in for the past 90 days or has never activated their Snowflake account. An admin must flush out the dormant user accounts if they are not required, to save costs.
There can be costly consequences when you don’t set resource monitoring checks while working with highly scalable, pay-per-use cloud platforms such as Snowflake.
It is common for data teams to receive several thousands of dollars in unexpected cloud data infrastructure costs. Civo’s recent survey data of over 1,000 cloud developers underlines this sentiment by showing that over the last year, 37% of public cloud users “have been stung by unexpected costs.”
Another example is lack of awareness about who (and how many users) is executing queries. Acceldata displays the number of users executing queries at any given time. The x axis displays the date and time (the values change based on the filters applied in Global Calendar), and the y axis displays the number of users executing queries. Each bar represents a date and time. When you hover over a bar, you can see the number of users executing the queries on the date and time, represented by the bar.

Get a free personalized demo of the Acceldata Data Observability platform to see how data observability can help your team save costs.
Photo by Maria Teneva on Unsplash


