


.svg)


The Hadoop ecosystem provides a suite of tools to load, process, analyze and maintain large sets of data. However, the number and complexity of components such as HDFS, Spark, Hive, and Kafka make the Hadoop ecosystem challenging for data teams to operate from a performance, reliability, and cost perspective.
To navigate this complexity and optimize your Hadoop environment, data leaders are turning to agentic data management. The Acceldata Agentic Data Management platform offers real-time intelligence of your data systems and automatically generates recommendations to optimize them.
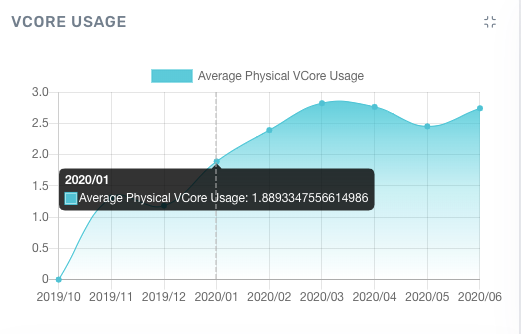
The human mind can quickly extract a lot of information from visual inputs. To make use of this, Acceldata comes with a rich suite of charts and dashboards. So, for example, as an alternative to manually compiling and interpreting vCore usage telemetry, Acceldata automatically generates an intuitive vCore usage chart.
Acceldata helps you track key metrics, predict and prevent incidents, and identify over-provisioned resources and other inefficiencies. Chargeback reports and usage analytics help align infrastructure costs with business priorities and requirements.
Without such a solution, you risk unexpected downtime, sub-optimal workloads, and cost overruns that can, in turn, impact business outcomes.
1. Get Core Usage Metrics In One Place
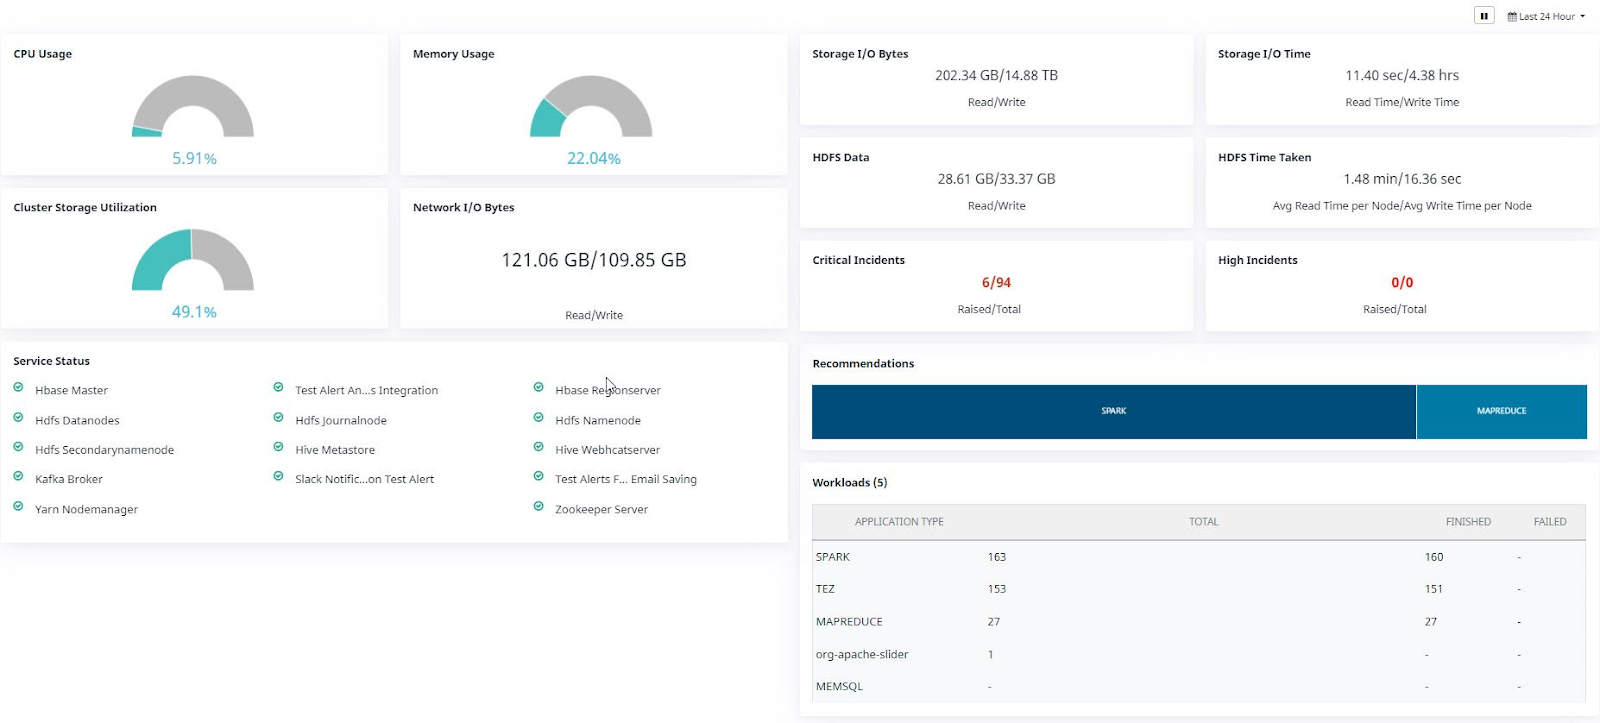
Acceldata comes with an extensive collection of charts and dashboards. These charts help you spot trends to predict and prevent incidents before they occur.
Get the following Hadoop usage metrics all in one place:.
- CPU Usage: Shows % of utilized CPU
- Memory Usage: Shows % of utilized memory
- Cluster Storage Utilization: Shows % of storage utilized by the cluster
- Network I/O Bytes: Shows the amount of incoming and outgoing traffic (read/ write in bytes)
- Service Status: Shows the current status of services attached to the cluster
- Storage I/O Bytes: Shows the amount of storage utilized (in bytes)
- Storage I/O Time: Shows the rate at which cluster storage is utilized (in ms)
- HDFS Data: Shows the amount of HDFS data utilized
- HDFS Time Taken: Shows the rate at which HDFS data is utilized
- Critical Incidents: Shows the number of critical incidents that are active
- Highly Critical Incidents: Shows the number of highly critical incidents that are active
- Workloads: Shows the number of currently active application workloads
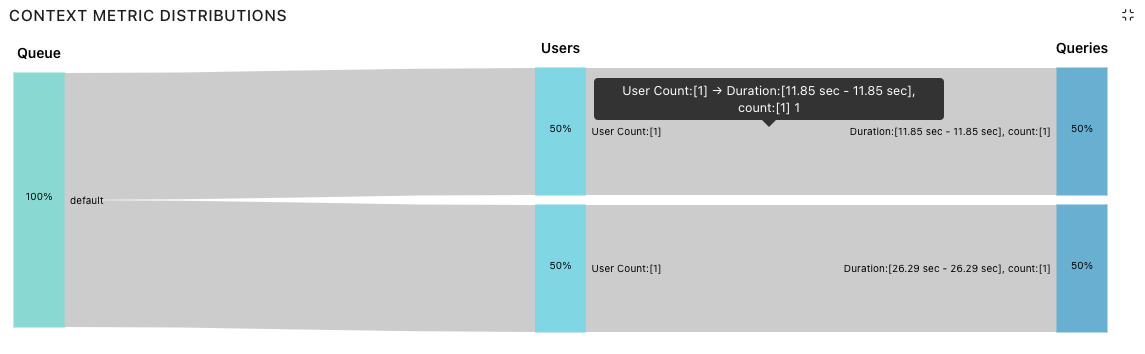
The Acceldata platform comes with Sankey flow charts to help you see how resources flow from your queue to users across different queries. This chart can help you identify exceptionally long query execution times and helps you understand why this was the case.
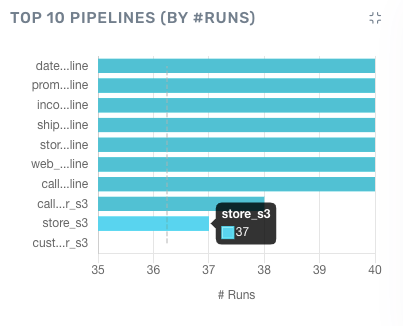
With Acceldata, you can easily compare queries, pipelines, or events against metrics such as execution time, the number of runs, or compute hours. For example, the below bar chart categorizes the top ten data pipelines by number of runs for each pipeline.
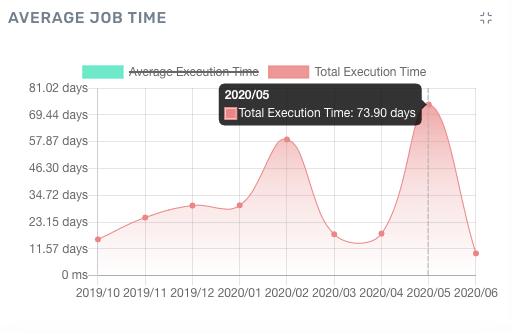
Acceldata allows you to view details such as average query execution time trends across a period of time. These charts help you understand whether or not you have adequately sized resources for your data operations.
2. Get Automatic Performance Recommendations
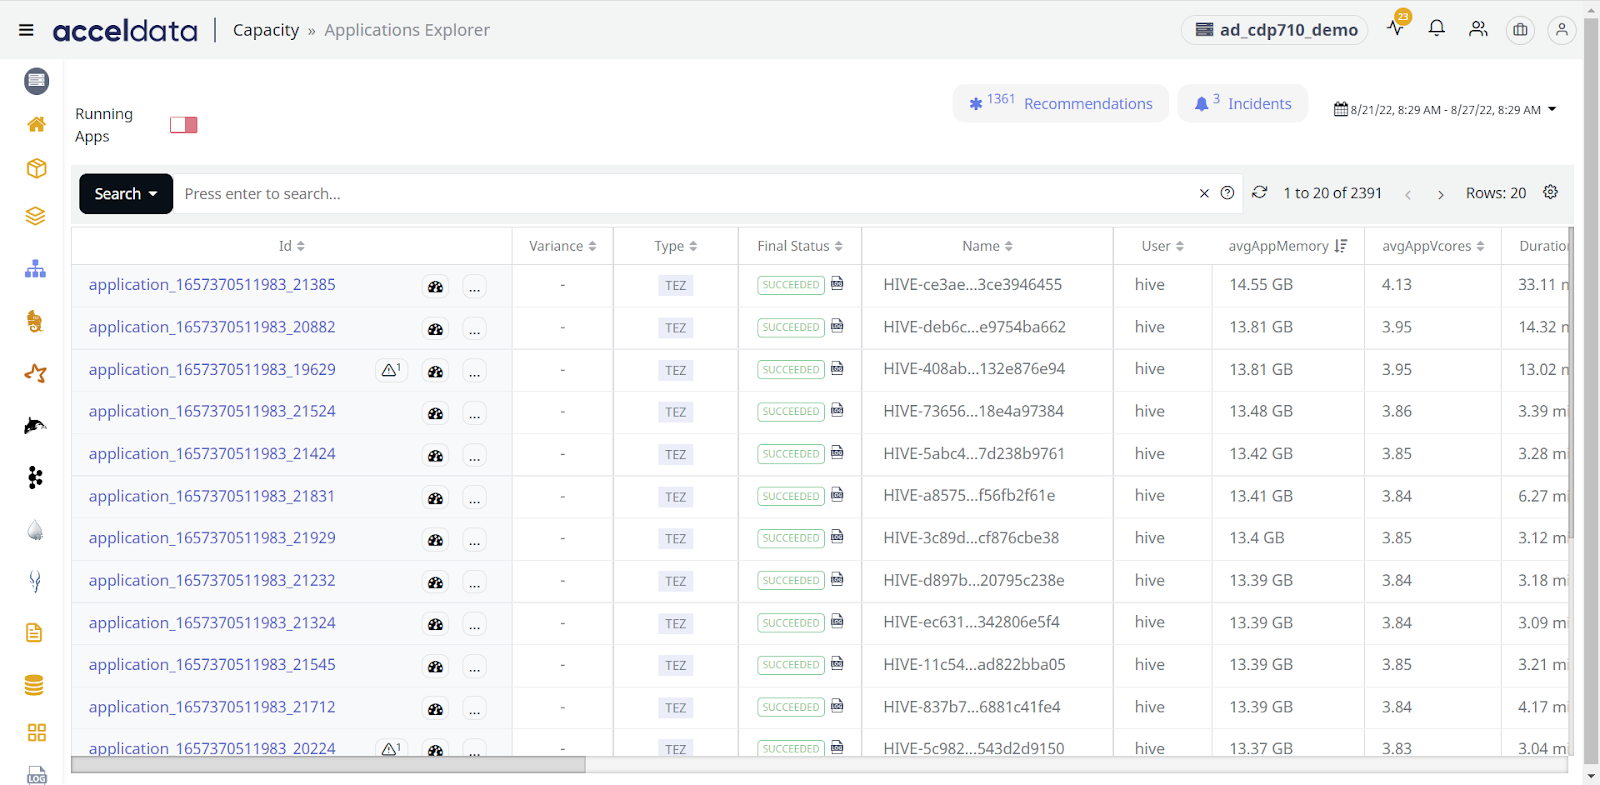
Acceldata provides automatic recommendations to help you cut through the complexity of your Hadoop ecosystem and identify important resource bottlenecks.
For example, if a few of your apps take up more memory than expected, then the Acceldata platform will automatically display a recommendation that shows you which app IDs are causing the high memory problem.
Such recommendations help you prevent unexpected outages as a result of exceeding infrastructure limits.
It also helps you decide between upgrading resources or scaling down application/query workloads. As a result, it can help you get the most value out of your data infrastructure.
3. Create Hadoop Alerts That Monitor Important Resources in Your Hadoop Environment
Use Hadoop alerts to monitor important resources such as CPU, VCore, memory, disk space, and YARN applications. Get an alert whenever a resource exceeds the threshold you specified.
Acceldata allows you to create alerts across 22 different categories including infrastructure, platform and services.
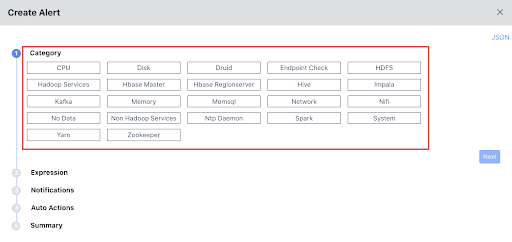
Set up these Hadoop alerts by defining the necessary alert conditions. The Acceldata platform automatically triggers an alert notification when these conditions are met.
The below image shows how easy it is to set a Hadoop alert condition when the sum of IRQ CPU usage time on all hosts and servers exceeds more than 10,000 seconds.
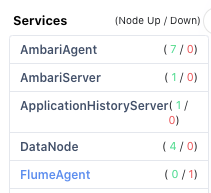
4. Track Health and CPU Utilization Across All Nodes
Get an overview of how many nodes each service is installed on. It also highlights the nodes that are working well and the ones that are down.
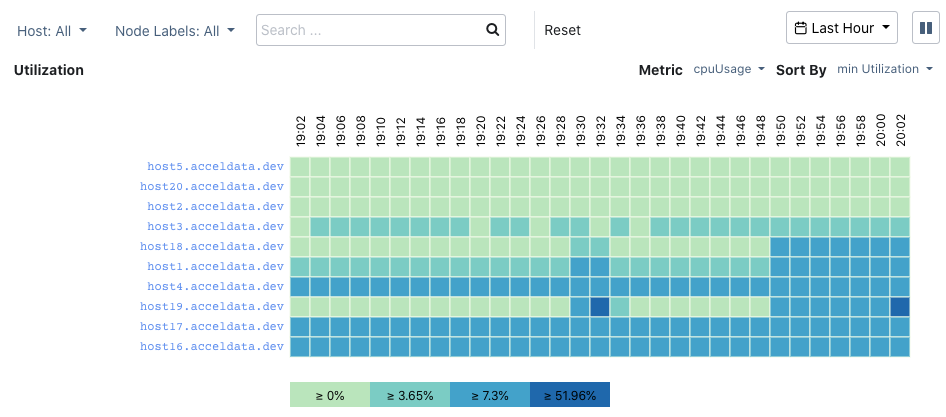
Use a heatmap to get the CPU utilization data of each node. Sort and filter on metrics and a time period to identify over-provisioned and under-provisioned nodes.
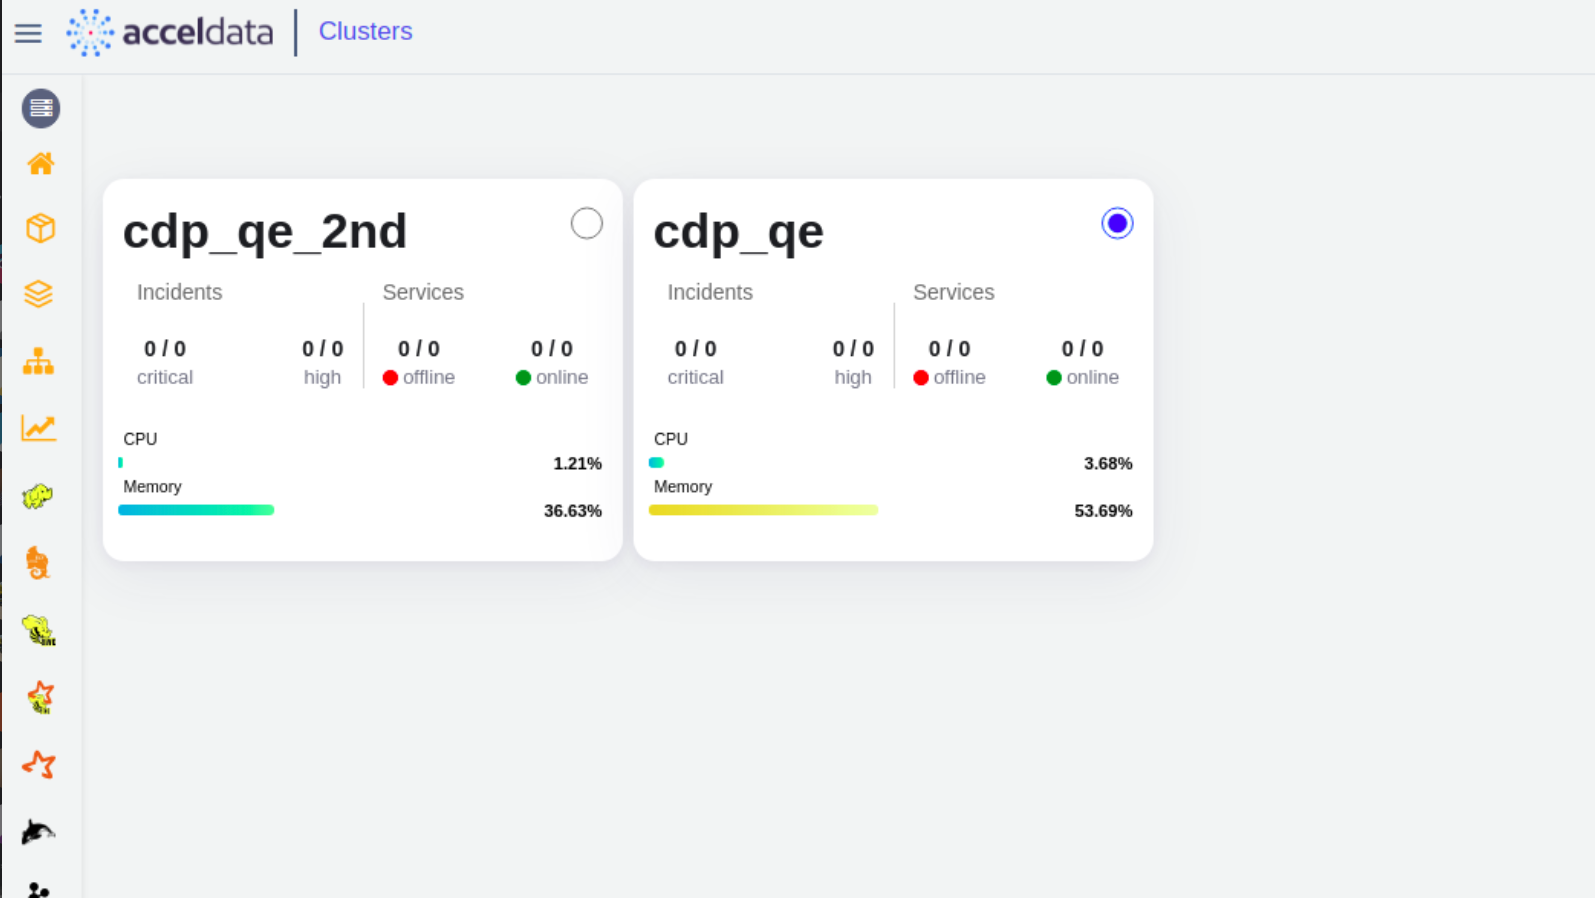
5. Track The Health of All Your Hadoop Clusters
Organizations often leverage multiple clusters to support different lines of business and technical requirements. Acceldata automatically shows CPU and memory usage for all your Hadoop clusters in one dashboard, helping you manage resources and plan for the future. It also notifies you of any critical or high-priority incidents.
6. Use Application Logs To Debug Unexpected Behaviors
When you run any application, Acceldata stores all important events into log files. In the event of unexpected behavior, you can use application logs to better understand what went wrong.
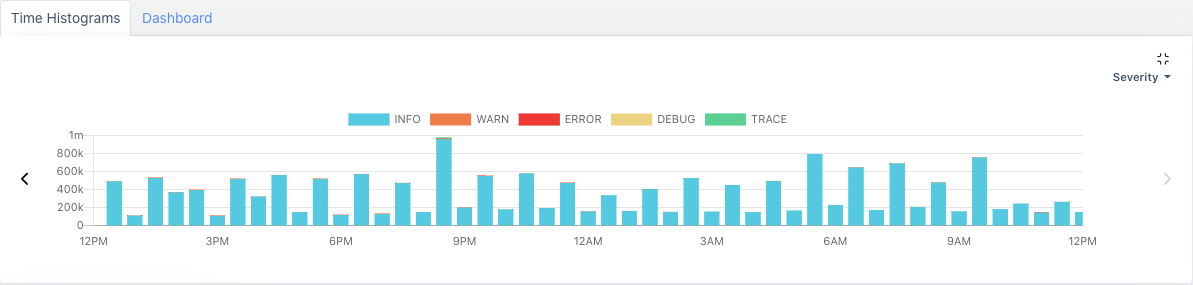
The Acceldata platform allows you to search logs by service, hostname, or source. Get a time histogram chart of errors, categorized by each service.
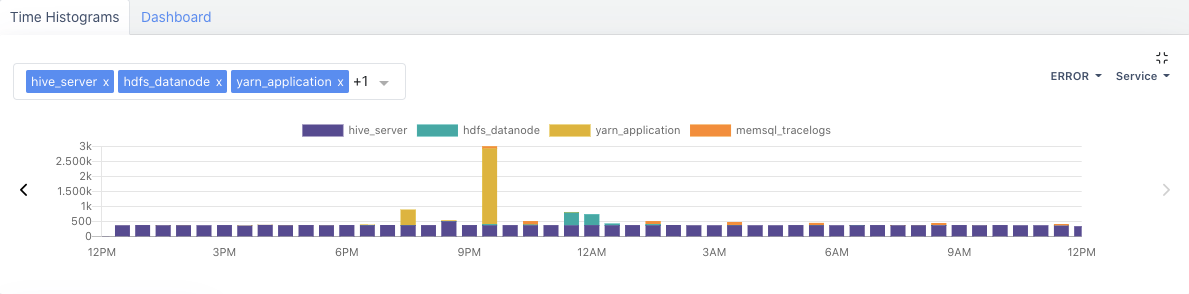
It also automatically generates a time histogram chart of errors, warnings, debugging, and traces and lets you filter information based on the severity of the error.
Making Hadoop Smarter with Acceldata's Agentic Intelligence
For many enterprises, the real challenge with Hadoop isn’t just performance—it’s the lack of real-time insight into how the system is running and where costs can be controlled. Without that visibility, teams often over-provision resources, miss optimization opportunities, and struggle to align infrastructure with actual business needs.
Acceldata’s Agentic Data Management Platform changes that. With adaptive AI agents, contextual awareness, and self-learning capabilities, it continuously monitors Hadoop environments, flags inefficiencies, and helps teams take smart, timely actions—automatically.
Take PubMatic, for example. By deploying Acceldata, they gained real-time intelligence into their Hadoop operations, optimized resource usage, improved performance, and avoided millions in unnecessary software licensing costs.
When your data systems can think, learn, and adapt in real time, Hadoop becomes less of a cost center—and more of a competitive advantage.


.webp)
.webp)


