


.svg)


Would you spend $72,000 on cloud computing services just to read and write test code for a couple of hours? Imagine the horror that struck this startup when they accidentally processed test code more than a hundred billion times and were hit with a five-figure bill instead of the $7 test they were hoping for.
But such mistakes aren’t the only reason for unexpected cloud infrastructure costs. Modern cloud computing services such as Snowflake make it easy for you to develop and scale data-intensive applications. But if you don't effectively manage your internal resources, small mistakes and sub-optimal resource allocations can snowball into an avalanche of unexpected cloud costs. Civo’s recent survey data from over 1,000 cloud developers shows that 34% of users find it difficult to calculate or predict how much their monthly cloud bills are going to be.
A multidimensional data observability solution can help you avoid unexpected costs in your Snowflake environment. It wires up your entire data environment to make your data layer more examinable. It helps you understand which operations cause the most cloud spending and compute resource usage. And it helps you to optimize your data operations.
Cost Intelligence Dashboard Estimates Your Snowflake Costs
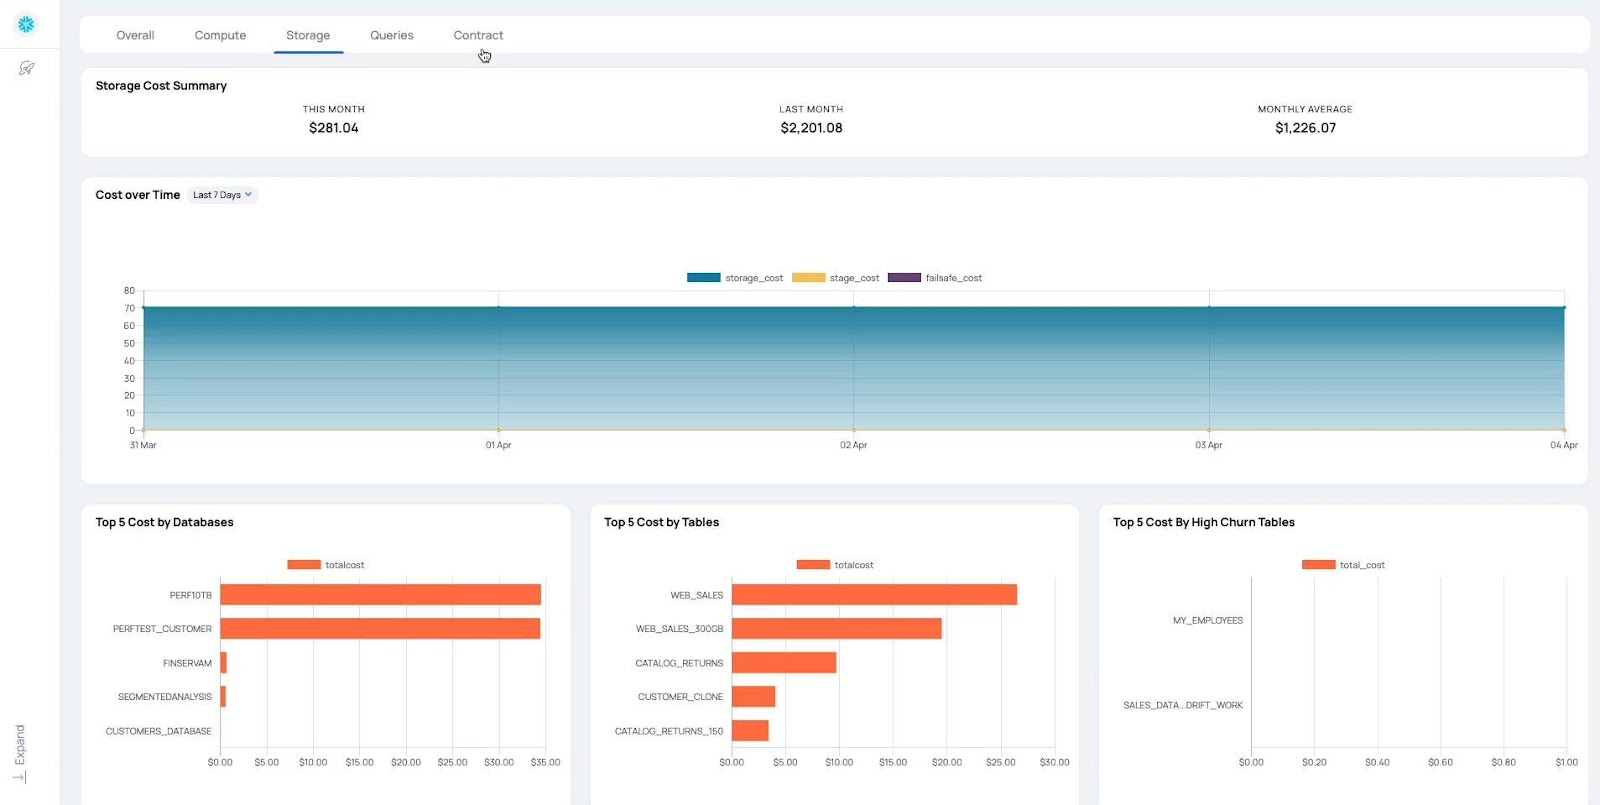
Acceldata’s cost intelligence dashboard automatically aggregates usage across all your Snowflake services and assigns a dollar-cost value. It also offers a granular breakup of cost trends across each Snowflake service, such as Compute, Storage, and Clustering. This helps you estimate your monthly bill even before it gets generated.

The dashboard also allows you to filter your spend by each service. For example, it can show you the compute costs over a selected month or day to help you single out daily or monthly problems with a particular Snowflake service. This granular dashboard view helps you identify underbudgeted or overbudgeted Snowflake services.

The dashboard also allows you to dig deeper into more granular costs. For example, you can see which databases or data tables cost you the most. With access to this information, you can easily identify problem areas that inflate your monthly cloud bills.
Automatic Cost Anomaly Detection Minimizes Unwanted Expenses
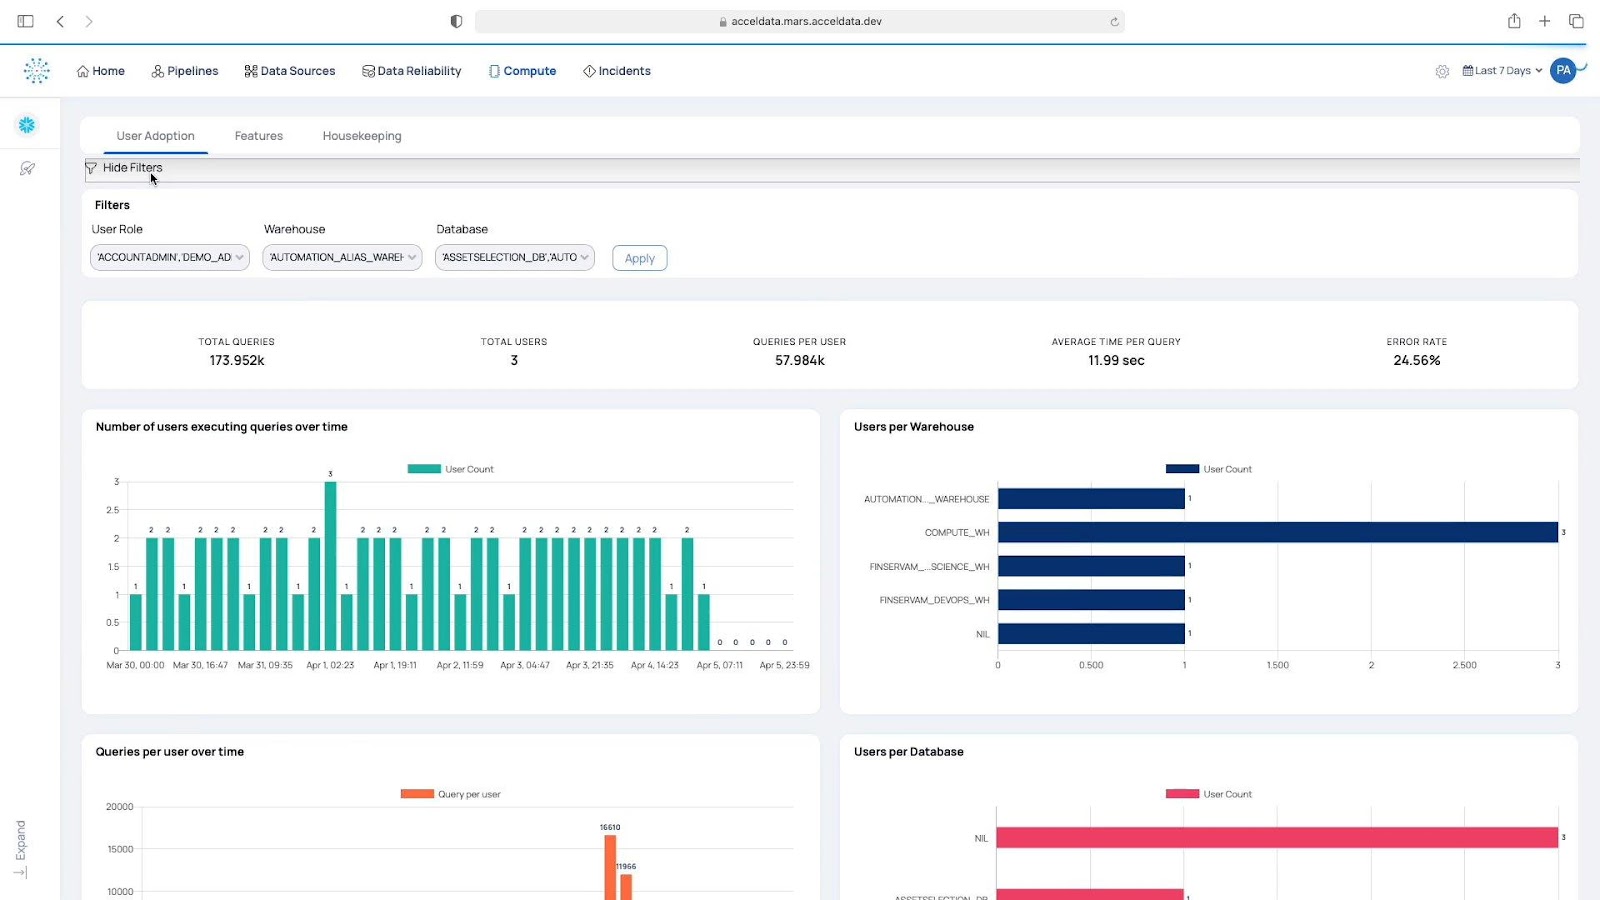
Acceldata’s Compute Observability features understand what your average compute resource usage boundaries are and automatically flag any workload spikes that fall beyond these boundaries, helping you to detect cost anomalies.

To help you proactively prevent unnecessary usage of computing resources, it automatically flags unexpected workload spikes that cause timeouts in your Snowflake environment. It also helps you investigate which users, queries, or errors caused these workload spikes.
Custom filters can help you map users to the data warehouses and tables they use. You can optimize your production loads by identifying which users execute the most resource-intensive queries from which data sources.
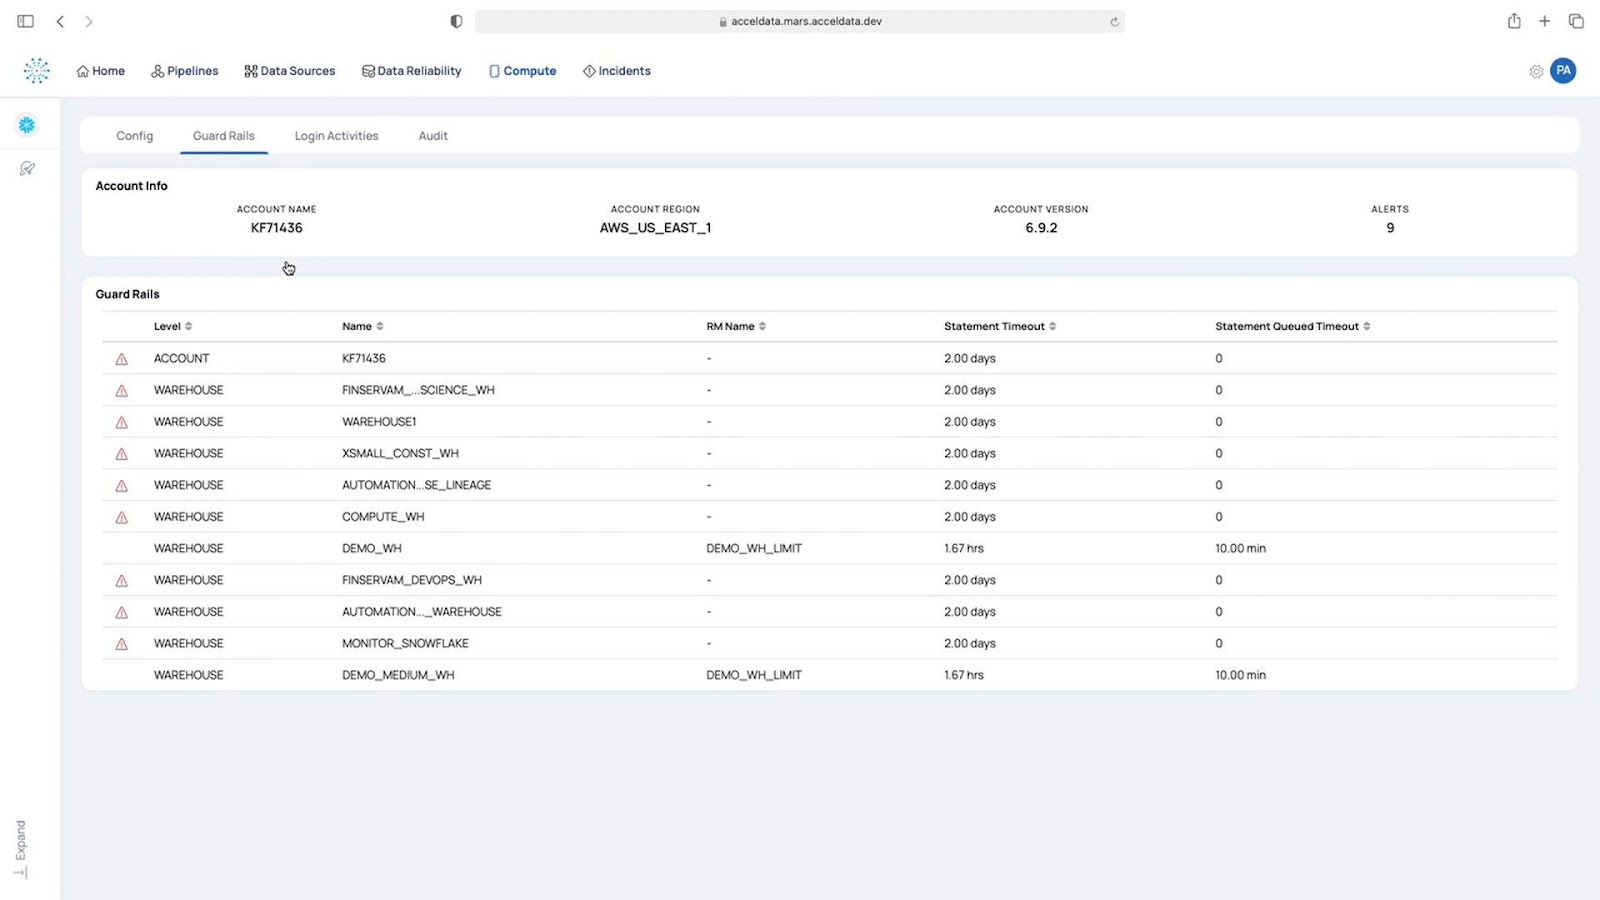
GuardRails identifies unexpected accounts, warehouses, and workload activities that trigger a Snowflake timeout. This automatically-generated list narrows down your problem areas and helps you investigate root cause problems faster.
Capacity Planning Offers Better ROI Out of Your Cloud Contract
Acceldata’s capacity planning feature helps you predict cloud resource consumption across all your Snowflake accounts and services. It identifies under- or over-utilization trends to help you get better value out of your annual cloud contracts.

For example, the above chart shows that based on current usage data, the company will only use 35% of its capacity. If this continues, the business will waste over $8,000 dollars in unused compute resources.
Instead of learning about this after the bill gets generated, the company can use Acceldata’s compute observability features to identify the under-utilization problem at hand. And the data team can make an informed decision about either utilizing more cloud compute resources or cutting back on contract costs.
Unexpected Cloud Costs Can Sink Companies — Do You Know What Your Cloud Expenses Are This Month?
According to Civo’s latest survey findings, enterprises on average spend nearly $50,000 per month on cloud deployments. If you are spending over half a million dollars annually on a service, any uncertainty over the return on investment is a potentially catastrophic blindspot. If you don’t know what your monthly cloud costs are, then you need Acceldata.
Remember the startup that signed up for a $7 cloud computing service and ended up with a $72,000 cloud bill? Without making your data environment more observable, you risk running into such unexpected cloud cost overruns.
A $7 test project can escalate into a $72,000 cloud bill within a few hours. Acceldata’s compute observability can help you avoid such unexpected cloud computing bills.
Acceldata’s compute observability features proactively keep tabs on all your Snowflake services. It helps you align your Snowflake production workloads with the recommended best practices. And it allows you to create custom incident alerts that notify you of any big cost or resource usage changes.


Photo by Aaron Wilson on Unsplash


