


.svg)


There is an ongoing debate about how data analysts can be most impactful in a distributed computing environment. Analysts are used to SQL’s returning answers to their questions in short order; it's an expectation that needs to be met for them to be successful in their jobs.
However, the RDBMS user is often unable to comprehend the root-cause when queries don’t return results for multiple hours. The opinions are divided, despite broad acceptance of the fact, that Query Engines such as — Hive & Spark are complex for the best engineers.
At Acceldata, we see full TableScans run on multi-Tera Byte tables to get a count of rows, which to say the least — is taboo in Hadoop world. What results is a frustrating conversation between Cluster Admins and Data Users, which is devoid of data that is hard to collect. It is also a fact that data needs conversion into insights to make business decisions. More importantly, the value in Big Data needs to be unlocked without delays.
In a previous blog, Managing Hadoop BI SLAs with Alerts & Automated Actions, we observed the method of isolating poor performing SQL Queries in a Yarn queue using Acceldata. At this stage the Hadoop Admin/Engineer is ready to unravel the scores of metrics and interpret the reasons for poor performance and taking resources away from the cluster causing:
- Runaway Resource Issues
- Runaway Timing Issues
- Spills that cause outages
The following details are mandatory before rectification steps can be initiated:
- Historical Query Performance (If the query is recurrent)
- View of the Execution — Mappers, Reducers, Efficiency of Joins
- View of Data — Which Tables (Facts Dimensions)
- Efficiency of Yarn Containers
- Execution Plan — (Logical and Physical plan)
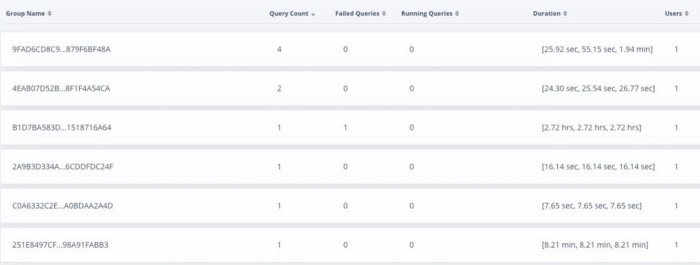
Historical Query Performance
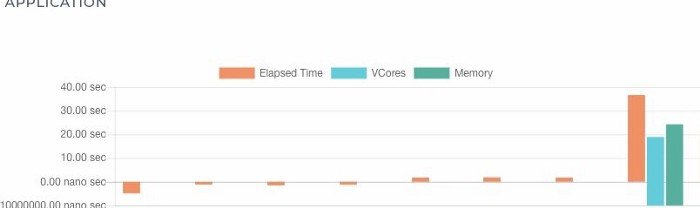
Acceldata APM fingerprints every SQL that is run on an interactive BI queue. This is done by parsing the AST and keeping in mind that the parameters of the regularly used queries continues to change, say for example — in the case of daily reports. Upon the next run of the SQL, Acceldata is able to correlate the past performance of that query with the most recent run. An aberration in the query execution parameters such as the following, represents an anomaly visually:
- Elapsed duration
- Data Read from HDFS
- Data Written to HDFS
- VCore Utilized
- Memory Utilized
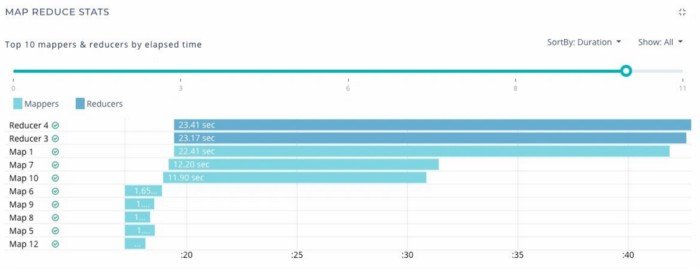
Execution View: On several occasions queries take a long duration when one reducer takes a long time, a ‘straggler’, consuming more than 90% of the elapsed duration. This identification can help in rectification; however, to get that today without the help of a cross-sectional view across various layers without logging into a number of servers is quite challenging. Acceldata visualises the duration, sequence of mappers and reducers, in combination with the Yarn Diagnostic logs.
The following is yarn diagnostic data which displays the Yarn Application’s execution stages from start to the end. This gives a clear idea if the Yarn Application underwent preemption, what was the allocation of memory and VCore, the number of containers at the disposal of the Job among the. Also available are diagnostic messages that allow the users to identify exceptions in the case of failing jobs, without leaving the UI at all.

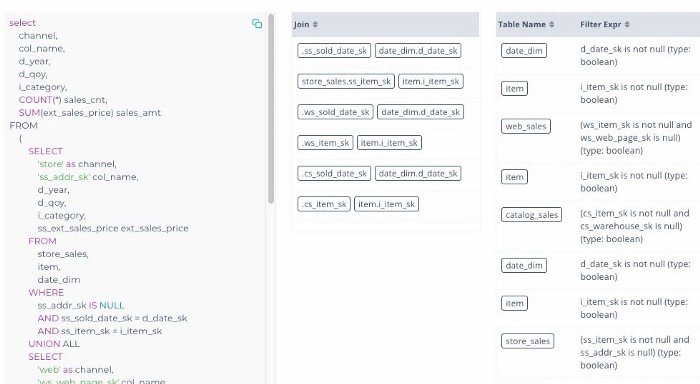
SQL & Data View
This section of Acceldata Query 360 provides a view of the SQL, the tables which were queried and the joins which were in play. Along with that there are details about the filter conditions and if the predicates were applied accurately or not, and if a particular join has had a debilitating effect on the query.
This is one of the most important aspects of SQL diagnostics, if not the most important one that an Admin/Engineer would like to understand in its entirety before making change recommendations about Query performance.
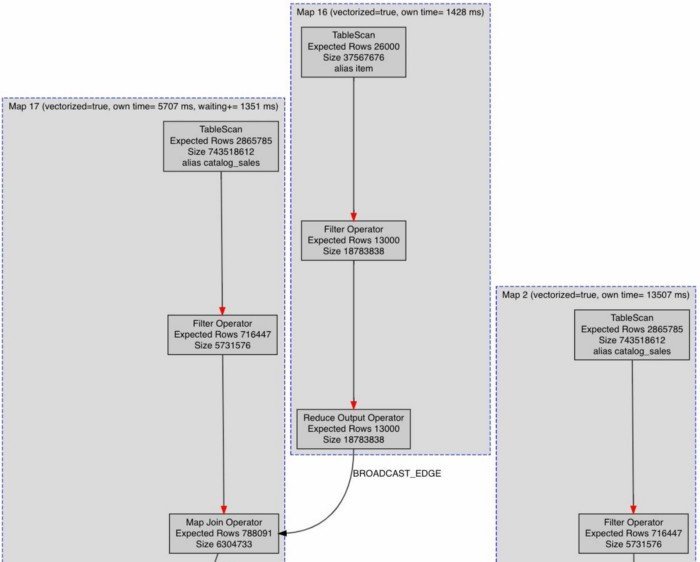
Query Plan
A final diagnosis around any query would need an understanding of the plan of the query. Acceldata supports query plans for all flavours of Hive & Map Reduce — Tez, MapReduce and LLAP. This provides an easy way for Admins and Data Engineers to understand whether — TableScans are intentional or accidental, where are the Broadcast joins occurring, whether CBO has kicked in, whether PPD was set for this particular query and what join optimisations can be done.
Tables
The effect of the layout of the Hive Tables is remarkable on query performance. In the absence of data compression, or accurate partitions it’s likely that tables are scanned end-to-end, or what is known as TableScan, and therefore the mappers will take a lot longer to complete, despite filter predicates.
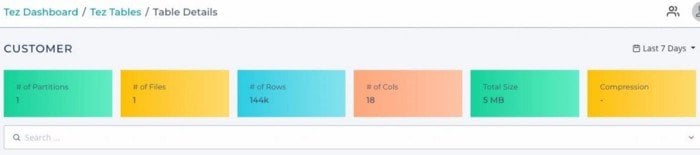
However in order to make a firm decision on the partitioning strategy, one needs to understand the combination in which that tables columns are getting used. It’s never about one query that the analyst is running, it’s always about a combination of a few queries that determines which would be an ideal partition key, and whether the table can be statically partitioned or dynamically partitioned. The view for that is available as under:
Conclusion
Hive and Spark users and Administrators have struggled to get a single view that represents the cross-section of Query/Job execution. Visibility continues to be a challenge in the distributed computing world, especially on Hive and Spark workloads. Acceldata enables the 360 degree view for decision making. Through the above sections, we can clearly see that the Admin/Engineer has all the information at his disposal to identify and rectify:
- Historical comparison of current run and past runs of the same queries
- The time when the query was executed
- Tables in question, joins thereof
- Mapper and reducer performance, anomalous
- Data layout on the physical file system, for partition strategy
- Query plan for quick and easy decision-making.


