


.svg)


.png)
Data observability isn’t just about seeing; it's about understanding. As data has become a central asset to all organizations, ensuring its quality and reliability is more critical than ever before. Comprehensive data observability solutions should improve operational efficiency by detecting issues proactively, thereby reducing production issues. That said, many data engineers feel their company’s chosen solution leaves something to be desired. With increasingly varied data sources and ever-evolving schemas, most data observability platforms fail to appropriately detect anomalies and trends that ultimately cost the company time and money. Data behaves dynamically, so why are so many of your insights seemingly static?
More likely than not, your limited analytics stem from your platform’s built-in limits around data profiling and historical context. Acceldata was designed with these two features in mind – that’s why our customers consistently report improved model performance after adopting the product. This post will walk through a few ways Acceldata acts as a “single pane of glass” to provide visibility into your data stores and pipelines; you can then act swiftly on your findings to ensure data reliability, cost optimization, and operational excellence for your enterprise data.
Holistic Data Profiling for Modern Data Structures
Partitioned data lakes are an increasingly common architecture used to optimize and manage vast amounts of data efficiently. When you segment data by attribute, data lakes often see a boost in query performance and a decrease in capital expenditure. Unfortunately, these benefits are limited if your observability solution does not account for the segmentation. Here are just a few problems you may encounter when attempting to profile partitioned data without the appropriate support from your observability solution:
- Misleading Metrics: If partitions are missed or misinterpreted, the metrics generated from your data lake can be misleading; for example, only scanning a subset of a partition introduces bias in metrics.
- Reduced Data Quality: One primary function of observability is ensuring data quality. Failure to handle partitions effectively results in undetected issues being propagated downstream.
- Performance Inefficiencies: Proper observability can pinpoint performance bottlenecks. Without it, some partitions may cause undetected inefficiencies, leading to slower data processing and increased operational costs.
- Inaccurate Anomaly Detection: Different partitions may have different data patterns. If the platform doesn’t handle partitions effectively, it may produce false positives or overlook genuine anomalies.
- Compromised Data Lineage and Provenance: Understanding where data originates and how it's transformed is crucial for many analytical processes. Ineffectively handled partitions might obscure this lineage, making tracing the data's journey hard.
- Operational Surprises: Without effective observability, unexpected issues such as partition failures, data skews, or unanticipated storage costs can arise, leading to operational challenges and disruptions.
Acceldata supports hierarchical and semi-structured data formats by seamlessly integrating with data stores such as Snowflake. Although Snowflake has rapidly grown in popularity, many observability platforms fail to account for its complex auto clustering and the semi-structured data it stores.

As shown in Figure 1 above, Acceldata provides automatic struct profiling with flattening depth for JSON-based assets. Using Kafka, Mongo, or Snowflake, you can configure the Acceldata platform to use complex formats like arrays to avoid losing nested information or data integrity. After all, while flattening arrays might seem like a quick and simplification tactic, it can introduce multiple complications and potential inaccuracies in data observability and analysis. Retaining the inherent structure of arrays in Snowflake ensures that data is represented accurately, preserving the richness and depth of insights.
Acceldata’s ability to handle structured hierarchies in formats like JSON, parquet, or relational databases separates them from other observability solutions. Accounting for hierarchical data is not only vital for deeply nested data but also for relationship mapping. Understanding entity dependency is crucial for debugging issues or ensuring data consistency in a hierarchical structure. Suppose there's an anomaly or outlier at one level of the hierarchy; Acceldata traces its potential impact up or down the structure, thus assuring data quality and improving the debugging process.
Better Insights for Variant, Complex Data
Whether you are using S3, MongoDB, or another semi-structured datastore, it’s crucial to understand the statistics associated with your data – especially if you are dealing with complex documents. Below, in Figure 2, you can see statistics related to the column external_links in the MongoDB table companies. Acceldata conveniently provides statistics with each column, like the average array length, max array length, and the percentage of arrays with unique values.

Perhaps even more importantly, Acceldata automatically displays detected patterns, anomalies, and trends in each field. This information provides a feel for the overall “shape” of the data you’re working with – knowing the distribution of values can assist in preprocessing, transformation, and even model architecture design for neural networks.

Tracking data trends is especially important when dealing with hierarchical data sources, particularly in non-relational data stores, as your schema will likely evolve. Acceldata can track changes in the schema, providing alerts if new fields are added or the structure changes.
You may be wondering how Acceldata can meet your organization’s unique needs. After all, there is no one-size-fits-all approach for observability, monitoring, and alerting. That’s why the Acceldata platform was built to meet customer needs – even those not yet anticipated.
Custom Observability Experience
Configure Data Partitions
We’ve already touched on the fact that Acceldata can provide insights into partitioned and non-partitioned data, but now we’ll show you the “how” as we look under the hood.
Below, Figure 4 shows the data source configuration screen for an S3-partitioned data lake, where each asset is specified using a regular expression and file type.

Acceldata can use the regex criteria to aggregate the specified files and provide comprehensive insights for your data lake.
Create Custom Data Policies
Once Acceldata is integrated with your chosen data source, you can configure custom monitoring and policies with one click to detect schema drift, data drift, data freshness, and data quality. These metrics can also be used to configure reconciliation policies. Let’s quickly touch on the difference between these concepts:
- Data Drift refers to the change in the statistical properties of data over time. It typically affects machine learning models trained on historical data to make predictions on new data that may not have the same distribution. When data drift occurs, the performance of machine learning models can degrade, as their predictions are based on outdated assumptions about the data's distribution.
- Data Freshness pertains to how recent or up-to-date the data is. Outdated data can lead to misinformed decisions, especially in rapidly changing environments or industries.
- Data Quality refers to data's accuracy, consistency, completeness, reliability, and timeliness. It encompasses various aspects, including missing values, duplicates, incorrect entries, and inconsistent formats. Robust data quality can lead to accurate insights, sound business decisions, and reduced trust in data-driven processes.
- Schema Drift is the change in the structure or schema of data sources over time. This might include adding, deleting, or modifying columns/fields or changes in data types. Schema drift can disrupt data processing pipelines, analytics tasks, or any system that expects a consistent data format. It necessitates robust mechanisms to handle such changes gracefully.
Reconciliation Policies can be used to ensure consistency in data quality between two or more data assets. Acceldata’s reconciliation policies can be customized by the user in the following ways:
- Source and sink asset info - Choose the source and sink assets to be reconciled.
- Rule definitions - Configure the desired type of reconciliation match, including data equality, hashed data equality, or profile equity match.
- Incremental strategies - Use an auto-increment ID-based, partition-based, or incremental data-based strategy.
- Schedule execution - Create a schedule by which to run the reconciliation policy.
- Alert configuration - Configure alerts to receive notifications on errors, warnings, or successes of the rule executions. Alerts can be sent to Slack, email, or webhook.
These data policies comprise several out-of-the-box, no-code rules that can be supplemented with low-code (SQL) rules or user-defined functions if necessary. The below Figure 5 shows an example of a customized Data Quality Policy:

The above Data Quality policy would check for the field “DATE” for consistency in schema matching, the existence of a valid tag on the fields “EMAIL” and “postalZip,” etc., thus automating the process of detecting certain anomalies and outliers.
The resulting execution summary will then provide a quick overview of which rules failed, why, and where:

Monitor Asset Performance Over Time
You can monitor an asset’s performance over time by seeing how its associated data policies perform. The policy execution checks create an overall “Data Reliability Score” for each asset, as shown in the line graph of Figure 7 below.
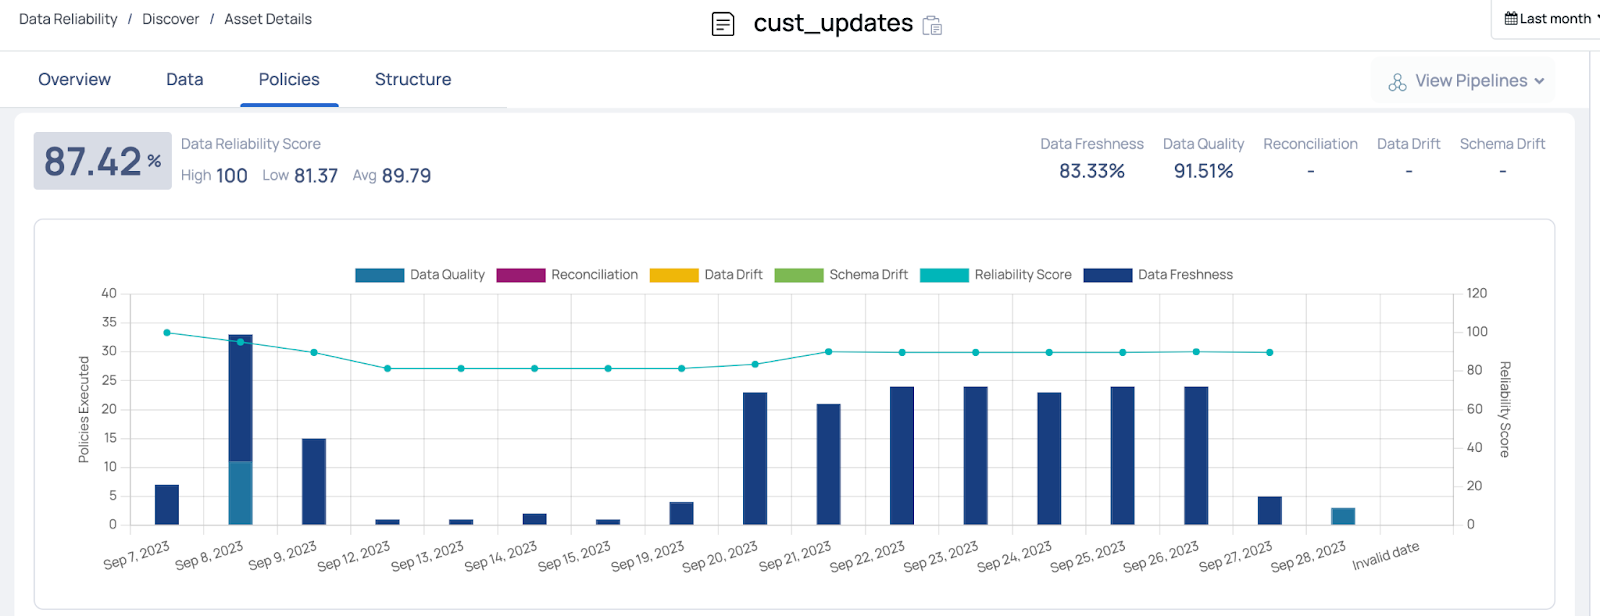

Using your data observability tool to monitor asset performance over time is crucial for several reasons:
- Preventing Model Decay: AI and machine learning models can degrade over time. As the underlying data changes due to evolving real-world scenarios, a model that once performed well can start delivering sub-optimal results. Regular monitoring helps detect this decay early.
- Maintaining Data Quality: The quality of data can change over time. New sources of errors might emerge, or changes in how data is captured or processed. Monitoring helps quickly identify anomalies or issues related to data quality, ensuring the models consume reliable data. Short-term fluctuations in performance metrics might be less concerning than long-term trends. Continuous monitoring can differentiate between temporary blips and more systematic issues that need attention.
- Auditing and Compliance: In many sectors, it's essential to maintain records of decisions made by AI models (e.g., in finance or healthcare). Monitoring asset performance ensures that models are compliant with industry regulations and standards.
- Continuous Improvement: AI is not a "set-it-and-forget-it" endeavor. Ongoing monitoring provides insights into areas of improvement, whether in data preprocessing, feature engineering, model architecture, or post-processing.
Monitor Data Movement in Pipelines
While most observability tools provide insights into assets and entities, Acceldata also shines a light on data operations. DataOps is the application of DevOps principles to data workflows and involves automating, monitoring, and optimizing data pipelines to improve speed, reliability, and quality. Besides automating data quality checks and reconciliation efforts, Acceldata integrates with platforms like Airflow to help you better visualize data pipeline operations. The below Figure 8 portrays an Apache Airflow pipeline in the Acceldata platform:

This pipeline graph shows an S3 job that sends transformed data to Snowflake. As you can see, Acceldata displays the data assets and processes side by side, clearly showing asset lineage in a way that minimizes failures in production. Below Figure 9 demonstrates how Acceldata provides custom alerts for your pipeline’s associated policy checks.
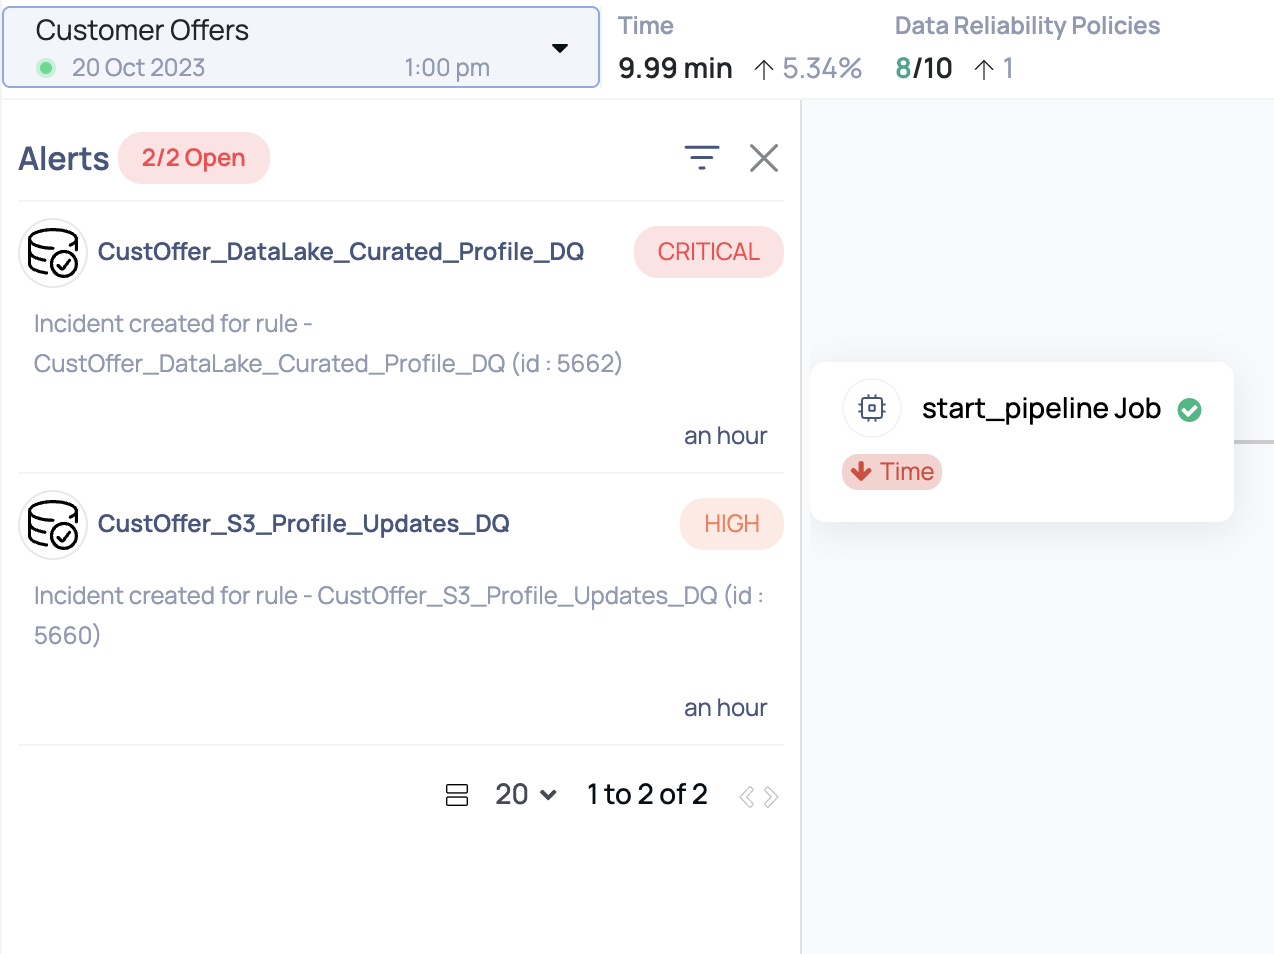
The alerts in Figure 9 flag data that fails custom monitoring policies that you can configure for your pipelines. You can detect issues sooner and faster by embedding these checks into your orchestration pipeline. You’ll also notice several other metrics at the top of the screen in Figure 9. Each pipeline run will display a summary of the passing data reliability policies and the total time it took for the pipeline to complete compared to the average runtime.
The Acceldata platform provides a central, holistic view of your data jobs by integrating with orchestration tooling like Airflow and Spark. But that’s not even the best part – the platform’s customizable data quality policies act as guardrails for reliable data.
With a robust data observability platform like Acceldata, you can promote early error detection while ensuring data quality and reliability across your pipelines and data stores. Invest in your team’s operational efficiency and request a demo today.


