.svg)


If you run big data platforms (Hadoop included), you know the reality: workloads grow, SLAs tighten, and teams are expected to do more with the same infrastructure and headcount. The biggest drain isn’t only compute cost—it’s the time lost to triage, tuning, and “what changed?” investigations.
That’s what shaped Pulse in 2025.
This year, Pulse delivered a cleaner and faster day-to-day experience, smarter resource optimization to improve throughput, and stronger Kubernetes support so teams can standardize operations at scale—while also improving build quality to reduce upgrade friction and patch-heavy maintenance.
If you missed it, here’s last year’s recap: Pulse Year in Review 2024
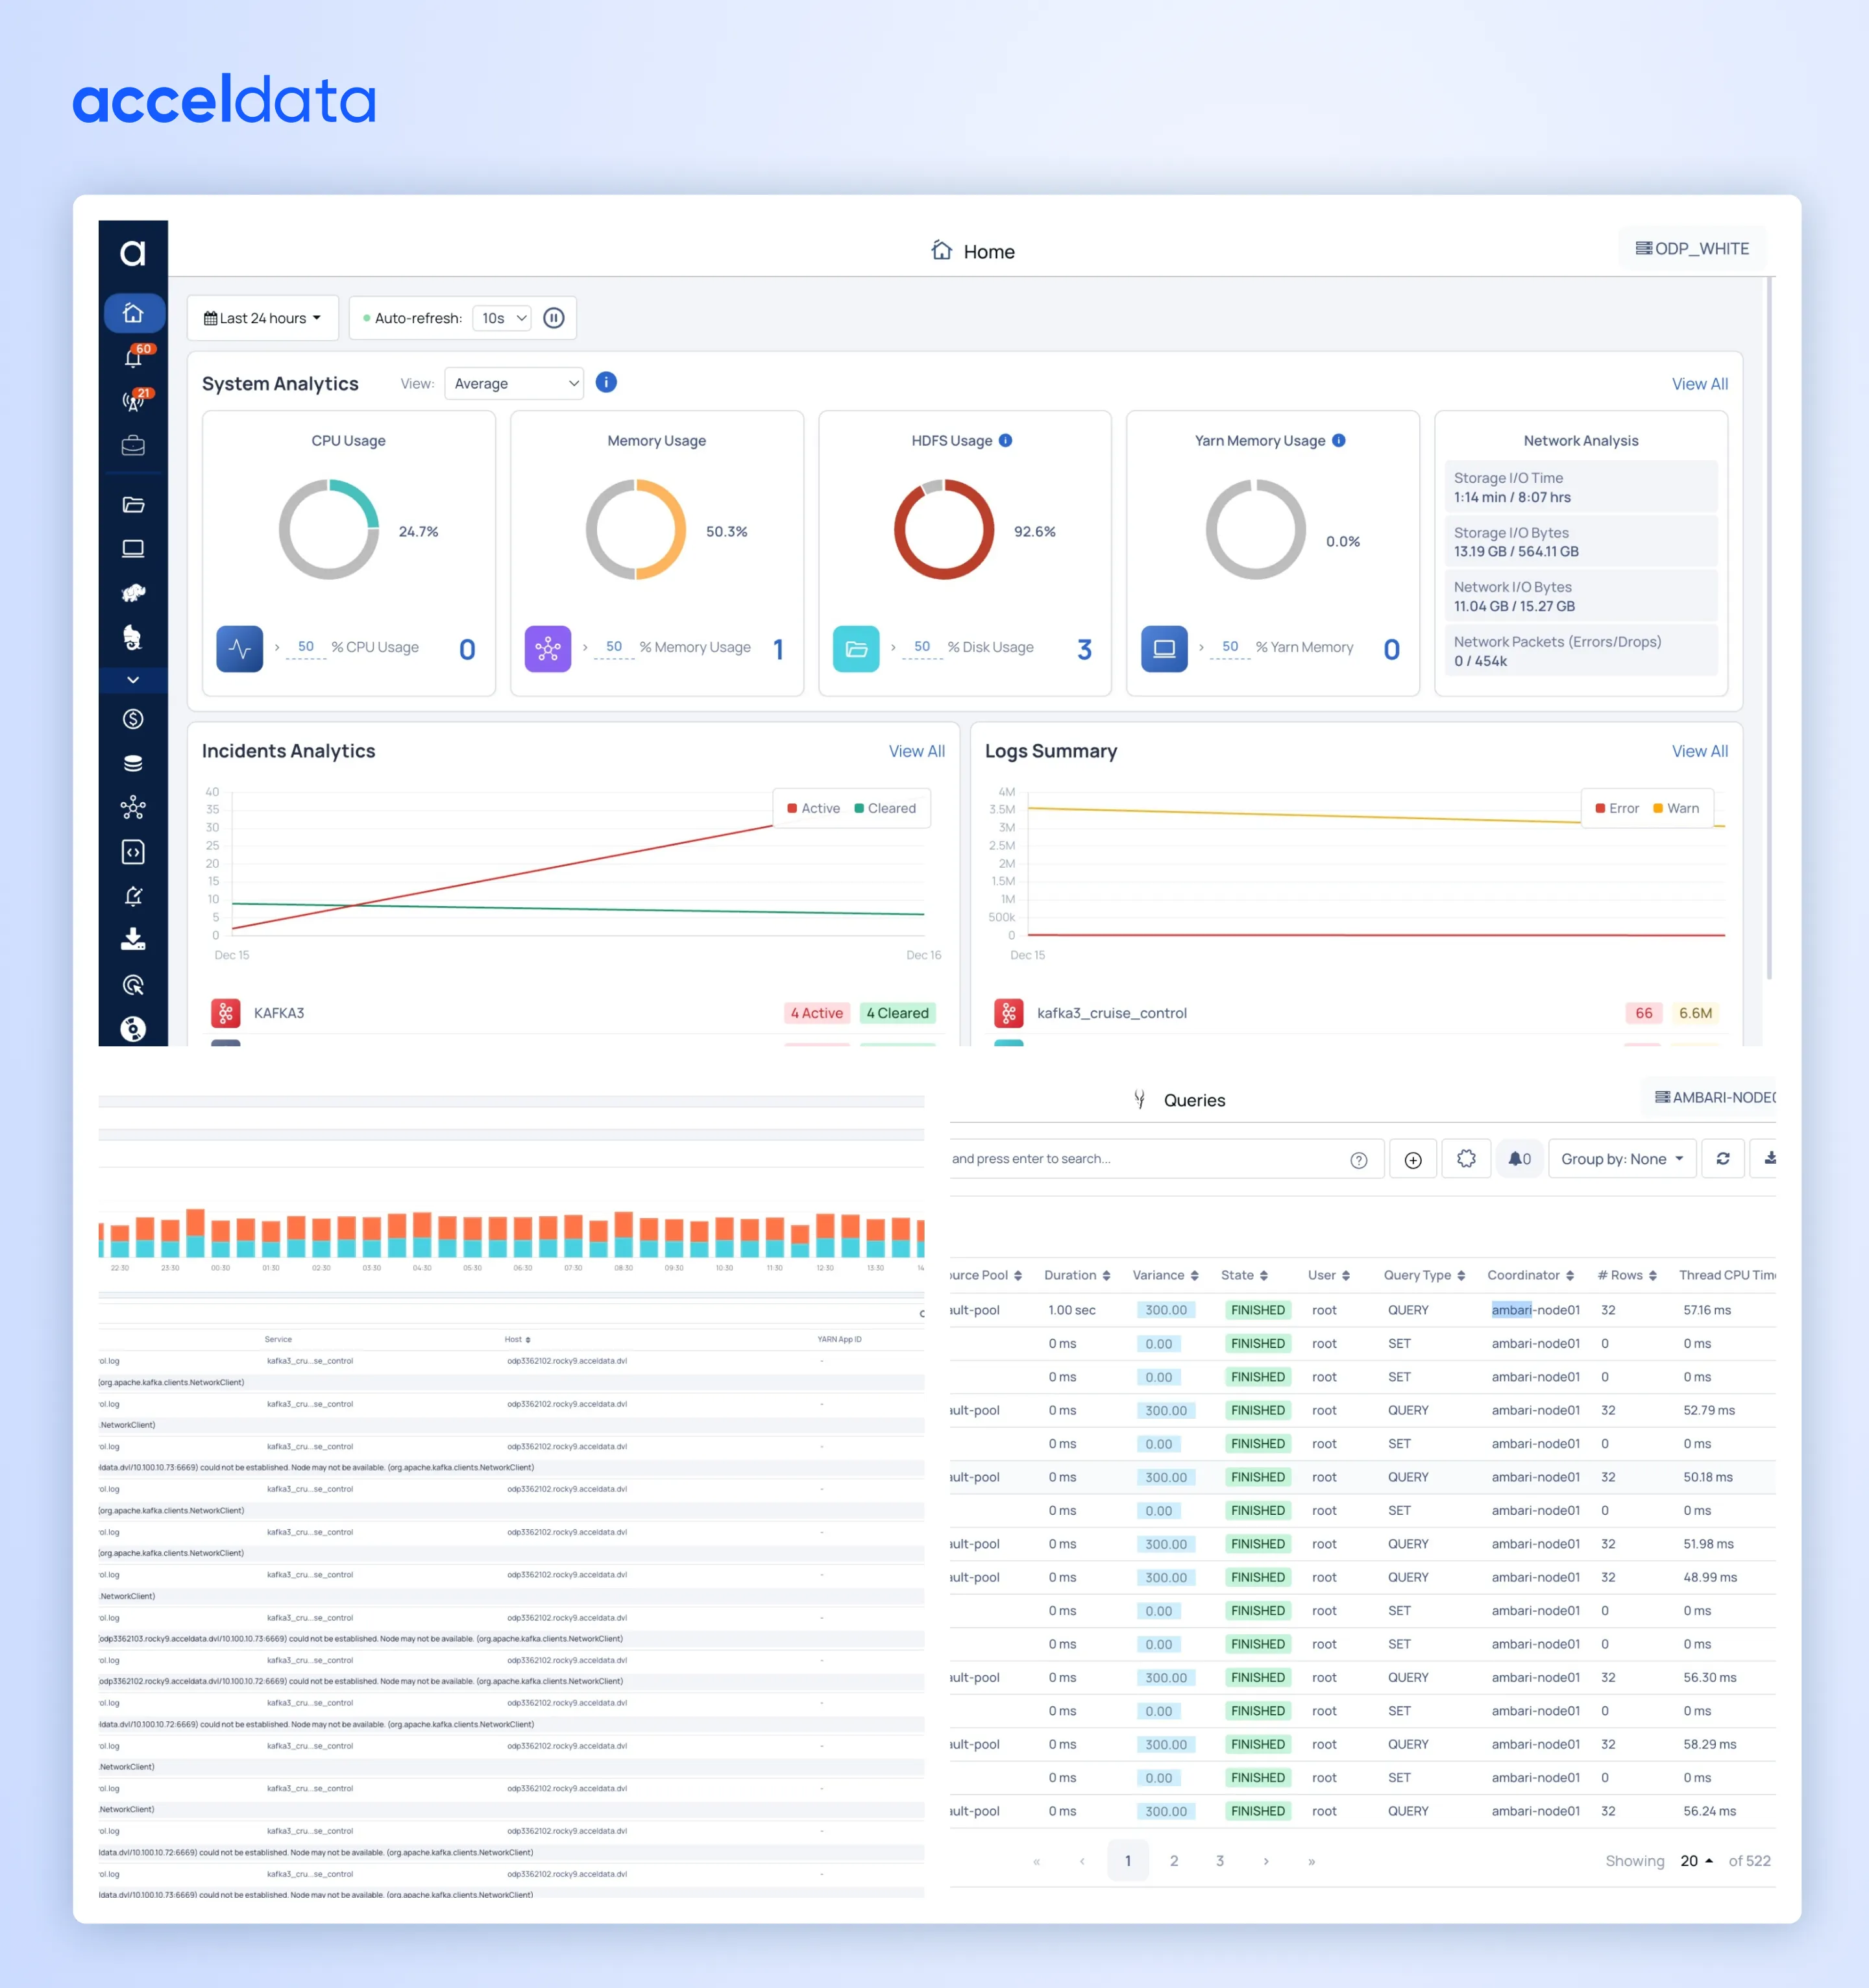
A simpler, faster Pulse experience (UI refresh in Pulse 4.0)
Pulse 4.0 introduced a refreshed UI designed for speed and clarity—so you can move from “something’s off” to “here’s what to do next” with fewer clicks.
What you’ll notice
- A cleaner layout that makes insights easier to scan
- Streamlined workflows across key pages (Home, Alerts, Nodes, YARN Optimizer, Admin, and more)
- Faster responsiveness across the platform
What this means for you
Less time hunting across dashboards and more time taking action—especially when incidents hit.
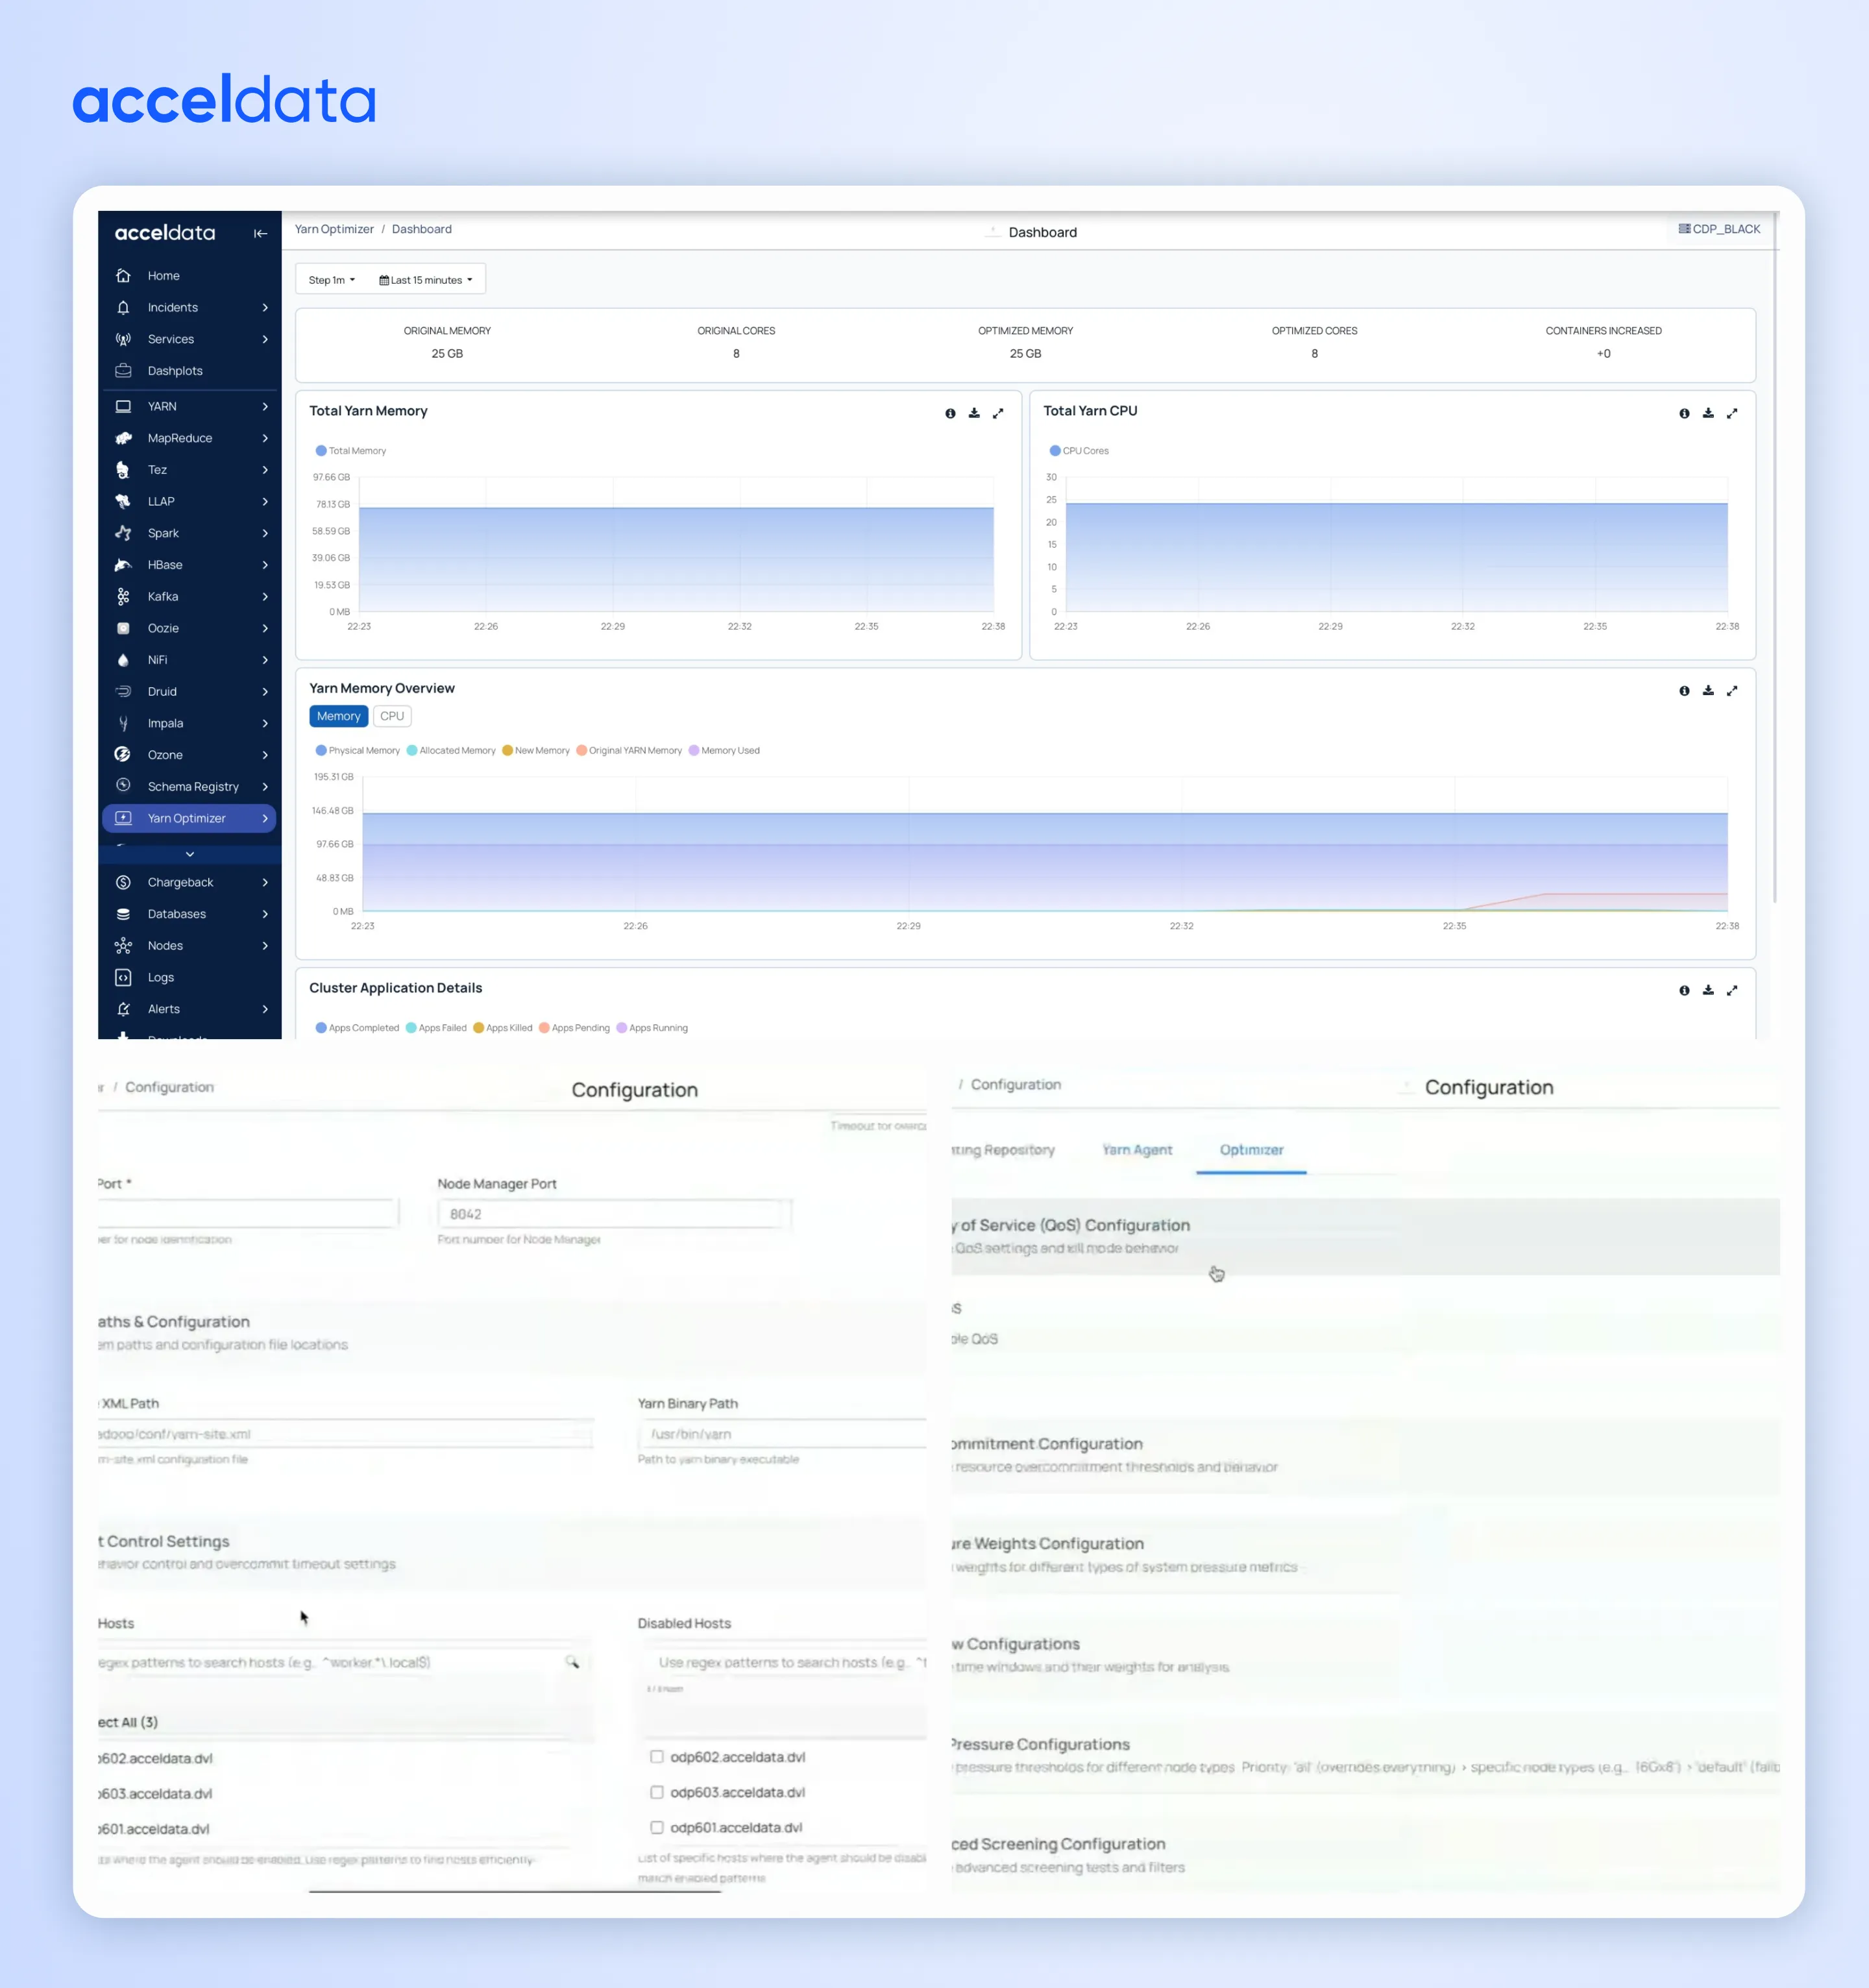
More throughput from the same cluster: Pulse YARN Optimizer
In 2025, Pulse doubled down on a core operator need: get more done without adding more hardware.
Pulse YARN Optimizer helps improve cluster efficiency by optimizing memory and CPU utilization across YARN applications—reducing waste and increasing throughput.
What it helps you do
- Identify over-allocation and inefficient resource usage
- Reduce queue pressure and stabilize shared environments
- Run more applications/containers on the same infrastructure
What this means for you
Lower cost pressure and fewer performance escalations—without replatforming or rewriting workloads.
Pulse Sense: AI-assisted troubleshooting
(upcoming release)
Pulse Sense is an AI-powered service agent designed to accelerate debugging and troubleshooting. It analyzes logs, metrics, events, and anomalies using an LLM, correlates signals across systems, and synthesizes evidence into actionable guidance—while maintaining confidence scoring throughout the investigation.
What this means for you
Faster time-to-diagnosis when incidents span multiple systems, and less manual effort stitching together signals across tools.
Accessibility improvements (WCAG AA alignment)- (upcoming release)
Pulse is improving accessibility across core user journeys, targeting alignment with WCAG AA guidance so more users can successfully navigate and operate Pulse—regardless of ability or assistive technology needs.
What this includes
- Perceivable: text alternatives for visuals, captions where needed, and sufficient contrast
- Operable: keyboard accessibility, clear navigation, and enough time to complete tasks
- Understandable: consistent patterns, predictable flows, and clearer error states
- Robust: reliable behavior across browsers, devices, and assistive technologies
What this means for you
A more inclusive experience for all users—plus stronger enterprise readiness for teams with accessibility requirements.
Security and governance: enterprise-ready integration
Pulse expanded support for common Hadoop security and governance controls, including:
- Knox
- Ranger
- Ranger KMS
What this means for you
Fewer blockers during security reviews, faster deployments in regulated environments, and smoother adoption in large enterprises.
Pulse Audit: compliance, traceability, and accountability
Pulse Audit adds stronger visibility into user activity and operational actions within Pulse.
What Pulse Audit captures
- User logins to the Pulse UI
- Creation and modification of dashboards, charts, and actions (who / when)
- User attribution for alert actions (including alert clears)
What this means for you
Better compliance posture, clearer traceability during incidents, and stronger operational accountability.

Standardize operations with Kubernetes-based deployment
As more platform teams adopt Kubernetes as the standard operating layer, Pulse expanded support for a Kubernetes-based deployment architecture where:
- Pulse core and add-on services run on Kubernetes
- Databases can run on VMs or bare metal for flexibility and performance needs
What this means for you
- Easier scaling and resilience for Pulse services
- Flexibility to align with your org’s approach to stateful systems
- A clearer path to consistent deployments across environments
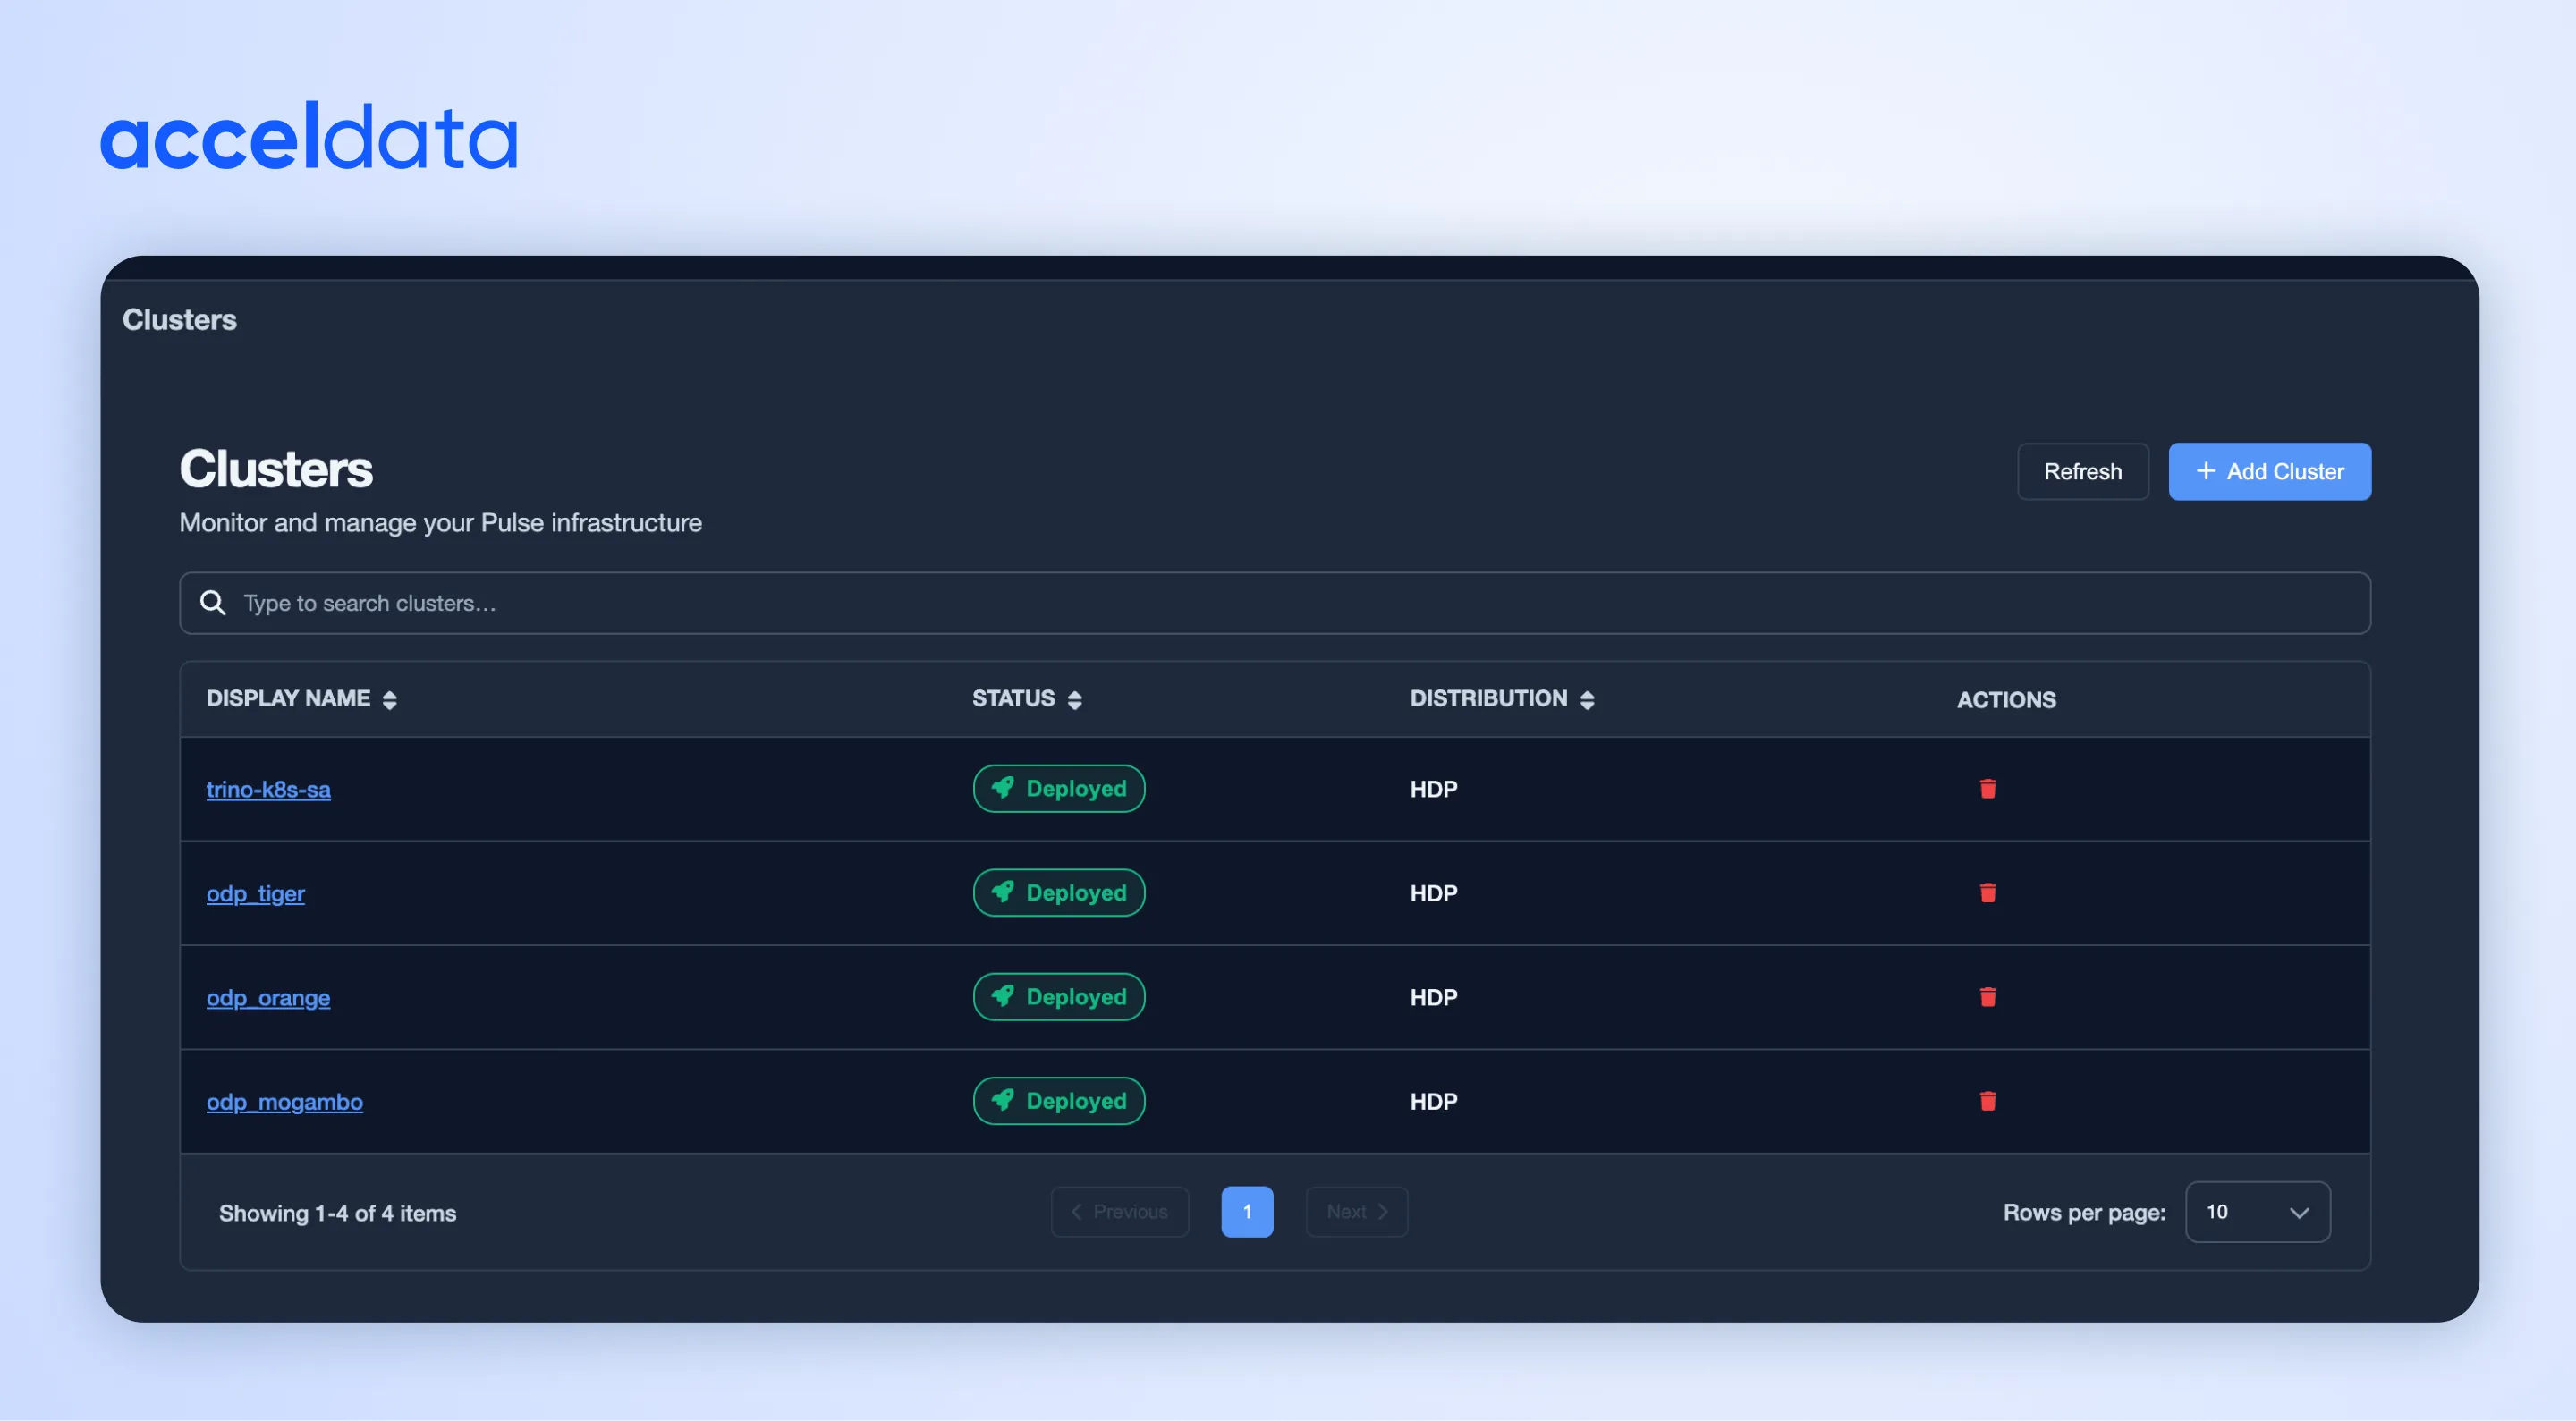
A new Admin UI for Kubernetes environments
Pulse introduced a dedicated Admin UI to simplify Kubernetes-based management and centralize common admin workflows.
What you can do in one place
- Configure clusters and deploy services
- Upload certificates and manage configurations
- Perform common administrative operations without tool-hopping
What this means for you
Faster day-2 operations and less overhead—especially in multi-cluster setups.
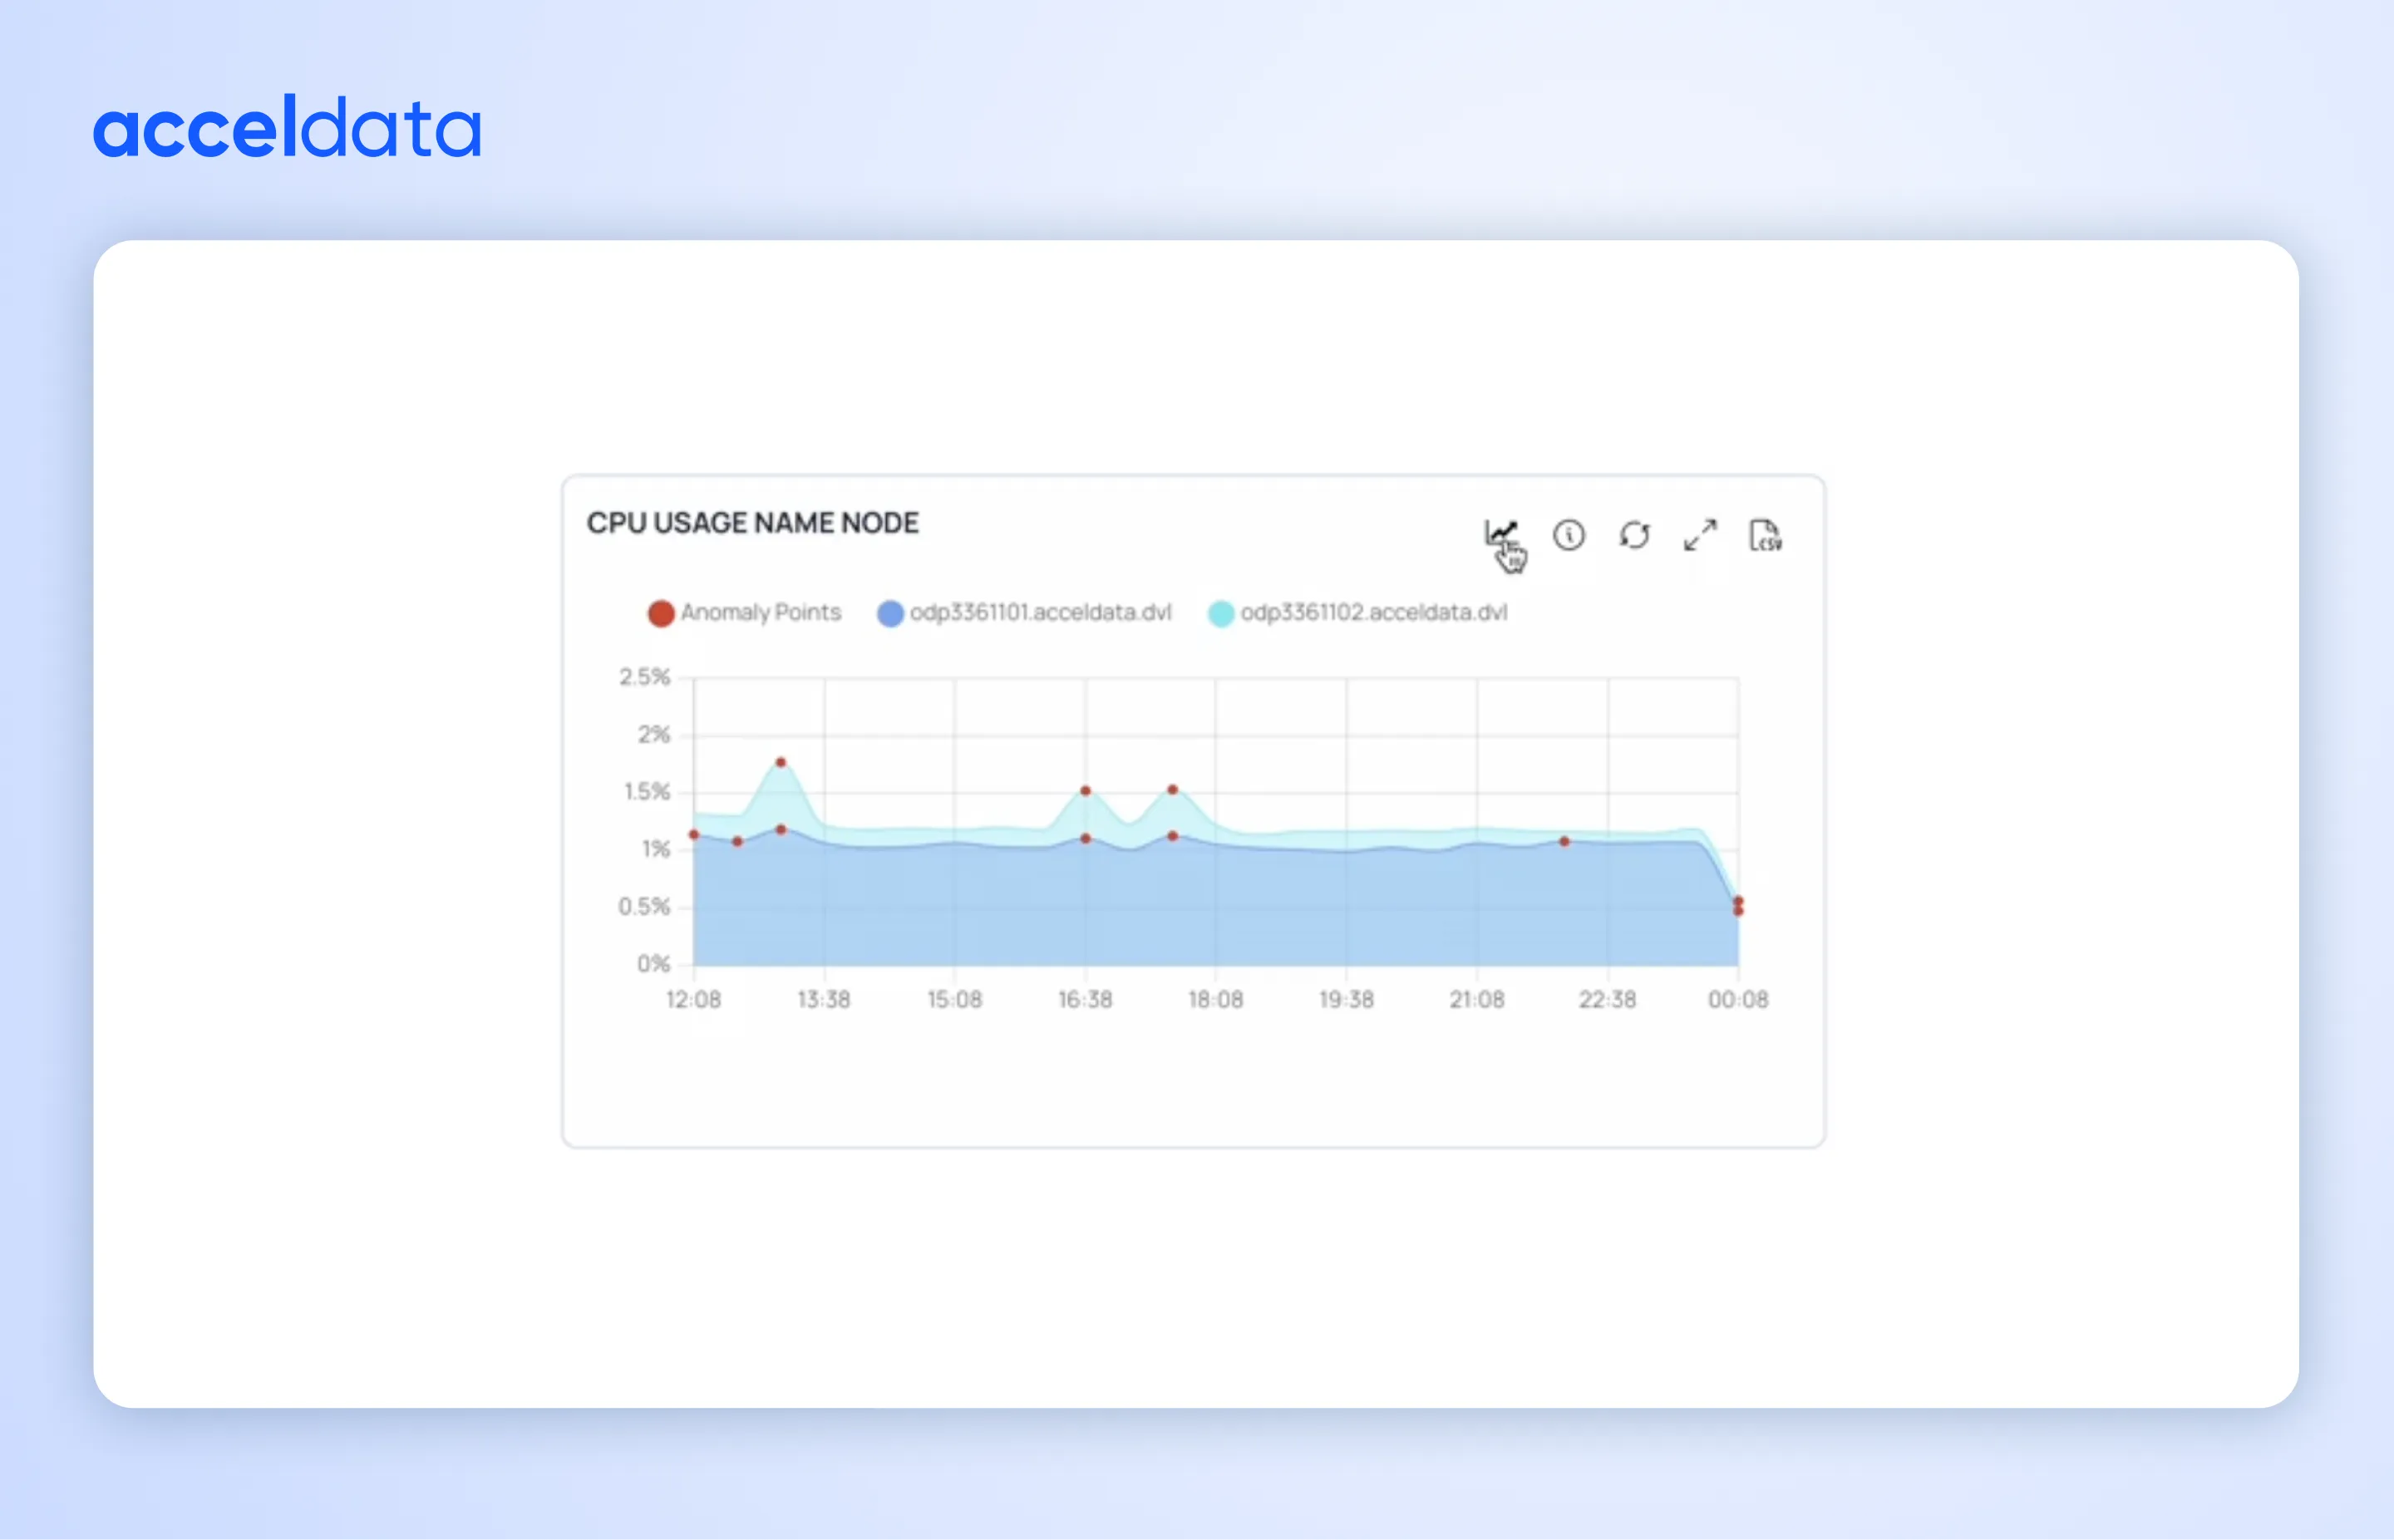
Catch problems earlier with Anomaly Detection and Forecasting
Teams don’t want to learn about issues when a job fails or a stakeholder complains. In 2025, Pulse advanced anomaly detection and forecasting to help you spot unusual behavior earlier—before it becomes an outage.
What it helps you do
- Detect deviations from baseline patterns in key metrics
- Highlight early signs of degradation or instability
- Reduce surprise failures by acting sooner
What this means for you
A shift from reactive firefighting to practive operations.
Stronger observability across core big data services
Pulse also expanded and refined observability across key big data systems—improving the signal you get when things are slow, stuck, or failing.
Where teams benefit
- Better visibility into long-running work and performance bottlenecks
- Improved platform health signals that reduce blind spots
- More reliable monitoring behavior in real-world edge cases
What this means for you
More confident diagnosis, fewer gaps, and faster root-cause isolation.
More actionable operations: new alerts and automated actions
In real-world operations, the win isn’t “more data.” It’s better, more actionable outcomes.
In 2025, Pulse added:
- New alerts to catch real operational risks (e.g., stale components and locking conditions)
- Action runbooks to automate repeatable interventions (e.g., automated handling of problematic YARN applications based on defined criteria)
- Metrics Search to quickly find metrics, understand what they represent, and configure alerts on them
What this means for you
Faster response, less manual toil, and more consistent remediation—without needing tribal knowledge to find the right signals.
Better day-to-day usability: dashboards, drilldowns, exports
Pulse delivered practical improvements that save time in daily workflows:
- A Nodes dashboard to quickly spot disk/HDFS/network bottlenecks
- Enhancements that make exploration and drilldowns faster
- Export and maximize chart capabilities for analysis and reporting
- Improved dashboard interactions to follow issues end-to-end with less friction
What this means for you
Less time assembling evidence and more time solving the actual problem.
New additions in 2025: Expanded observability coverage
Modern big data environments are rarely one engine or one datastore. In 2025, Pulse expanded observability coverage to support more of the systems teams rely on for interactive analytics, real-time workloads, streaming, and ML operations.
New additions include
- Trino — visibility into engine health plus query activity and performance
- Apache Pinot — monitoring across controller/broker/server signals for real-time analytics environments
- Apache Kudu — deeper service metrics and operational signals for performance and stability
- ClickHouse — component health plus query performance and resource utilization
- Apache Flink — application/job visibility to support streaming operations and troubleshooting
- JupyterHub — monitoring signals for shared notebook environments and multi-user platform stability
- MLflow — observability for experiment tracking and ML lifecycle workflows (usage and operational signals)
What this means for you
You can standardize observability across more of your stack—so triage stays consistent, context stays connected, and teams don’t need to jump between tools to diagnose issues.
What’s next
As we move into 2026, the direction stays consistent: more proactive detection, more automation, and faster time-to-resolution—especially in complex environments where signals are spread across metrics, logs, events, and dependencies.
Learn more
Learn more about Acceldata Pulse
Book a free consultation to understand how Pulse can help with your specific environment or use case.