


.svg)


.png)
Last year, Rohit Choudhary, Acceldata’s CEO and one of our co-founders, explained understanding the lag in your Kafka cluster. In his piece, he provided a detailed summary of how Kafka is being used in modern data environments, and why it’s so important for organizations who are trying to get real-time insights into their business operations.
While Kafka produces so many important benefits for data engineering teams, a variety of key business processes become hindered by a phenomenon called consumer lag, which is the delay between a consumer’s most recent committed offset and the producer’s end offset in the log. Experienced practitioners agree that preventing consumer lag is the biggest challenge in Kafka.
In Rohit’s original blog, he explained, firstly, why lag occurs in some consumer groups more than others:
It’s possible that some consumer groups exhibit more lag than others, because they may have more complex logic. It can also occur because of stuck consumers, slow message processing, incrementally more messages produced than consumed.
Attempts to reconcile offsets and actions often create their own unintended consequences, which is where so much frustration happens. Rohit said:
Rebalance events can also be unpleasant contributors to consumer lag. In real-time conditions, the new addition of new consumers to the consumer group causes partition ownership to change - this is helpful if it’s done to increase parallelism.
However, such changes are undesirable when triggered due to a consumer process crashing down. During this event, consumers can’t consume messages, and hence consumer lag occurs. Also, when partitions are moved from one consumer to another, the consumer loses its current state including caches.
The Acceldata platform operates as a single, unified dashboard for Kafka monitoring. We’ve provided end-to-end visibility into Kafka and allow enterprises to scale technology adoption without worrying about operational blindness. To understand specifically how this happens, and to see how data teams are applying effective Kafka monitoring through data observability, you might want to first take a tour of the Acceldata platform.
In the product, you’ll see how Acceldata’s Kafka dashboard allows you to optimize Kafka analysis and consumer lag reduction. The following is how Acceldata users are managing their Kafka dashboard.
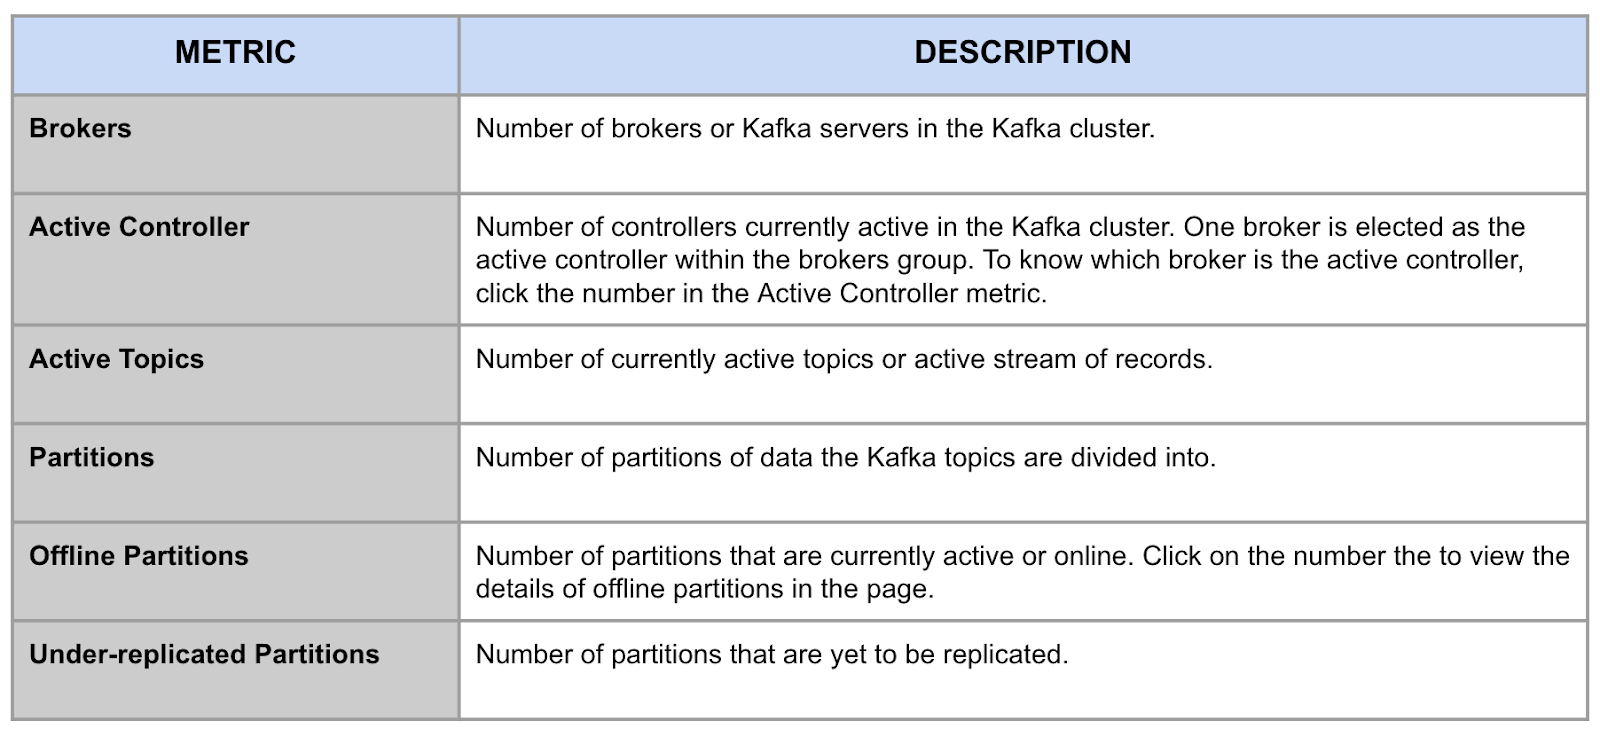
The following metrics are displayed in the summary panel.

Kafka Streaming Details
Kafka streaming lets you analyze data stored in your Kafka cluster to monitor the distribution of data streams. Data is distributed across the following partitions.
- Producer: A producer is the source of data in your Kafka cluster that sends the data to multiple topics in the broker. You can view the topics to where a producer streams data.
- Topic: A category where streaming and publishing data is stored. Multiple streaming data can be stored and can be published to one or more channels or consumers.
- Consumer: A category where published data from topics is read. One category can read published data from multiple topics.
The following image is a representation of Kafka Streaming Details.

Streaming Details
To view the distribution of data to or from a single unit end-to-end, click the element. You can then see all incoming and outgoing streams. You can also search by name by typing the element name in the search box. This displays the list of streaming and publishing pipelines.
Kafka Events
Events are any occurrences of a stream or message in a pipeline. You can monitor the internal events in the Kafka ecosystem for a faster throughput and better stability in a data pipeline. There can be multiple events in a day that you can observe as shown in the following image.

Other Charts on the Kafka Dashboard


