


.svg)


A data mesh is a decentralized data architecture pattern in which data is owned and managed by independent teams within an organization. They are optimized to remove the bottleneck of centralized data teams and allow businesses to move faster by giving them direct access to the data they need.
However, this also means that enterprises are trusting the business teams' ability to use the data platform responsibly and with expertise. Understanding who is using what resources (and how) becomes critical for cloud-based data platform administrators to avoid extremely high costs. This is where FinOps comes into play. It helps keep teams up-to-date with their spend, usage, and keeps spend under control, and generally create an environment where data teams can develop a discipline of cost optimization.
Data Spend Visibility Through FinOps
FinOps is a cost control strategy specifically designed to help track and manage customer data spending across teams, organization units, and even the entire data stack. By giving users access to granular visibility into where their budgets are being consumed and by whom, FinOps makes it easy for customers to allocate costs to appropriate organization units and cost centers. Additionally, this powerful tool allows users to track data stack spend against allocated budgets, helping them stay informed and alert whenever their budgets are exceeded. Whether you are an individual data scientist or part of a large team, FinOps is the right solution and approach for managing your data costs effectively and efficiently.
Core features
In the world of cloud computing, a spend analysis chart is an essential tool for tracking and managing cost consumption. This type of analysis enables you to get granular insights into your data resources by drilling down into specific services, accounts, or application workloads. Additionally, you can use tags or other criteria to further refine your data and gain even more in-depth insights.
A spend analysis chart is also useful for FinOps teams, as it enables chargeback to be controlled and distributed across different departments based on defined parameters. With this type of consolidated view, finance teams can easily track costs across all their cloud resources in a single pane of glass. Whether used for day-to-day operations or to provide regular financial reporting to stakeholders, a spend analysis chart is an invaluable tool in any organization's cloud strategy.
Through the use of budgeting, you can centralize your budget at the unit or cost center levels to ensure that your consumption is within the budgeted limits. This enables effective planning and control of your cloud data costs, helping you to stay on track with your spending. Not only does budgeting allow you to carefully track your data usage across all components, but it also generates reports that provide granular insights into your consumption at both an aggregate and individual level. These reports can help you identify areas where you might be able to optimize your budget by reducing wasted spend or finding underutilized resources.
Additionally, there is a special spend reduction page which provides even more cost-saving recommendations based on your specific usage patterns.
Acceldata Data Observability Cloud
Acceldata has developed the world's first enterprise data observability cloud to help data teams ensure reliability of their pipelines, and it provides visibility into data environments to identify, investigate, prevent, and remediate data. Data teams increasingly understand data observability can turn you into a cloud FinOps expert.
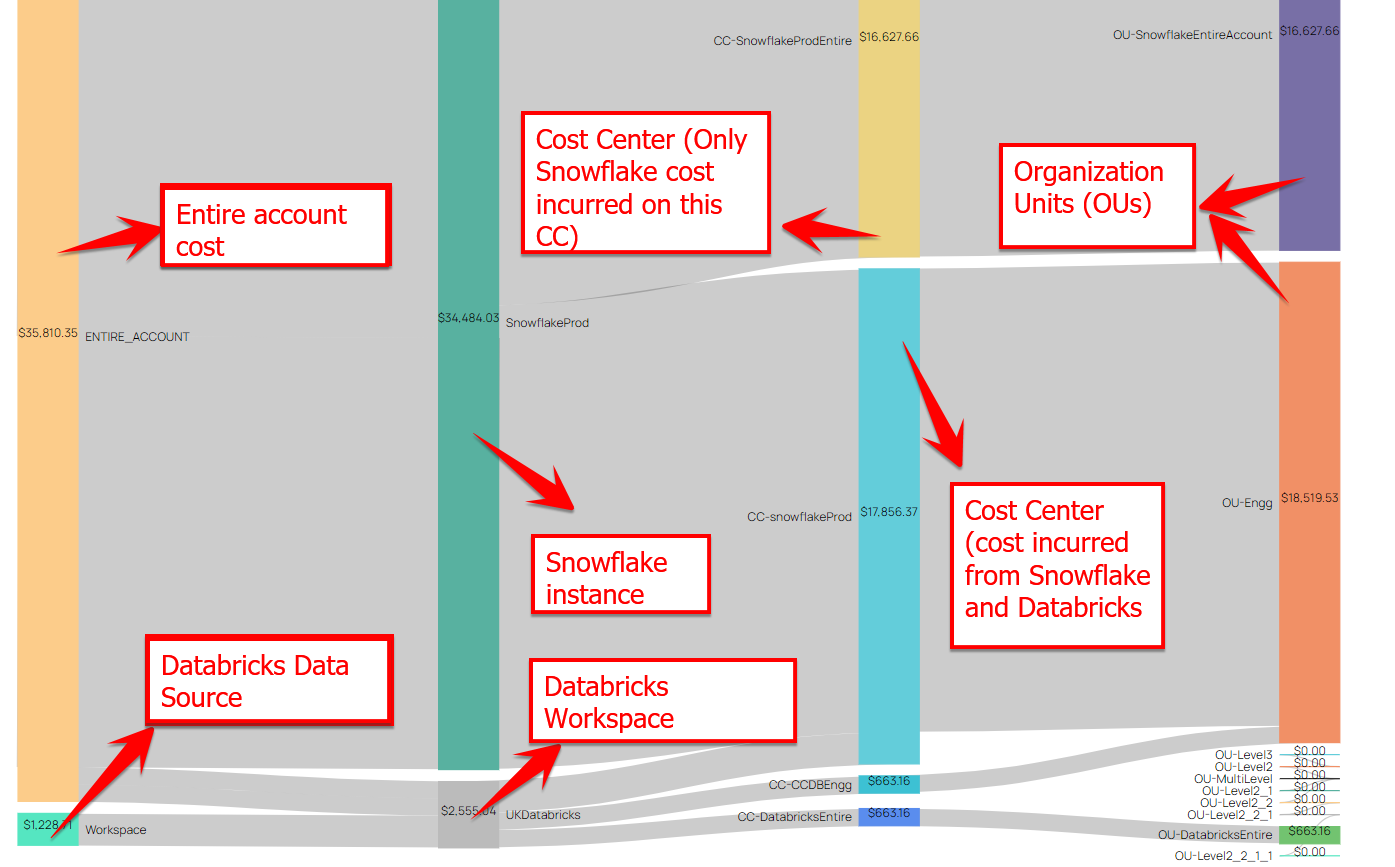
Acceldata’s data observability cloud provides a Chargeback feature, a powerful tool for managing and tracking your organization's data spend. With the data observability cloud, you can create multiple organizational units and cost centers that can span across different data platforms. These entities make it possible to easily track spending across all of your data environments, allowing you to stay on top of your costs at all times.
In addition, this feature utilizes cost allocation tags that you can configure within your data platforms using tags such as Snowflake-Object-Tagging or Databricks-tags. With these tags, you can easily allocate your costs to the appropriate organizational units or cost centers depending on your needs. And if the data platforms you use do not yet support tagging, Chargeback also provides you options that let you create organization units and cost centers on top of them.
At Acceldata, we understand the importance of budgeting for business success. That is why we offer a user-friendly platform that enables businesses to easily create budget alerts based on their specific needs and budget parameters. You can set budgets that help you keep track of spending in each of your organization units or cost centers. You can also use these budgets to forecast spending for the remaining budget period so that you are always prepared for any changes in your data needs.
Finally, by allowing users to identify both actual spend and forecasted spend, our platform gives them complete visibility over their overall expenses. Additionally, users can specify the threshold for their alerts, choosing from a variety of percentage options depending on their budget size and goals. And with our advanced visualization tools and customizable notification channels, users can stay up to date with all the latest spending trends in real time.
Whether you are a small start-up or an established multinational, Acceldata provides what you need to effectively manage data spend. Whether you are a data analyst, manager, or administrator, Acceldata’s data observability cloud’s Chargeback feature makes it easy to manage and optimize your organization's data spend.


