


.svg)


Enterprises are increasingly focusing their efforts on data -- how to source it, optimize it, and utilize it. Their goal is to derive the most value from their data investments and apply that data to reduce costs and develop new and innovative data products.
We are at an inflection point for observing data, data pipelines, and event streams. The time for data observability has arrived as its own distinct product category. There is already a groundswell of product offerings accompanied by a lot of top VC dollars in this space, which makes the rationale for data observability to be a standalone category even more imminent in the year 2022.
As with any new product category, there will be differences in what makes up must-have features and what are nice-to-have features, and this blog provides an evaluation criteria for identifying what is most essential. Enterprise leaders looking to deploy data quality tools and data pipeline monitoring tools will see that the criteria here will provide a path to finding the best data observability platform to help them optimize their data operations.
Key Takeaways
The data observability space is rapidly maturing. Key takeaways include:
- A comprehensive data observability layer extends beyond data and into the applications and infrastructure layers. When you have all three, a complete picture emerges of your data’s journey and its interactions with the infrastructure. When any one layer is missing, the observed data can lead to an incomplete representation of the state of the data.
- The data observability environment should be almost invisible by providing a minimal footprint deployment that automatically scales and does not add significant performance overhead to the already stretched pipeline.
- IT professionals need ease of use and manageability of the data observability environment to ensure its strong adoption. It is hard to realize the value of data observability with limited and partial use.
Recommendations
Data and analytics professionals responsible for ensuring a healthy end-to-end pipeline should consider data observation to:
- Enable application modernization and data transformation activities by optimizing the data engineering team resources.
- Reduce the cost of rework and remediation by “shifting left” the detection of errors and anomalies for voluminous data.
- Scale the runtime environment to meet an increase in demand in the most cost effective manner.
Analysis
Observability is not a luxury. It is the window into a complex environment that is used to ensure the success of your enterprise data initiatives. It is especially critical for data infrastructures that are growing rapidly and are struggling to drive revenue and cost savings. When the environment comprises open-source and proprietary products spread across on-premises data centers and multi-cloud, observability becomes the glue to tie together various moving parts of the architecture.
To learn more about data observability, please refer to these articles — What is Data Observability? and Data Observability Accelerates Modern Data Stack Adoption.
Data management has been lagging industry-leading methodologies and approaches when compared to the rest of the IT stack. It is only now that data assets are being thought of as data products. Data has also finally adopted decade-old DevOps concepts and is now actively developing its DataOps practices. In the same vein, observability practices are now becoming standard operating principles for modern data teams.
Figure 1 shows the observability space, specifically for the IT teams.

Established observability products, such as Splunk, Datadog, AppDynamics, New Relic, and others are focused on infrastructure and operations metrics, but they don’t know, or care about, about data’s context or its meaning. They are in the “observability data’’ space, compared to the new field of “data observability”. Figure 2 shows how this space is witnessing massive growth. There are already over a dozen companies offering some aspect of observability that is being leveraged by the business teams.
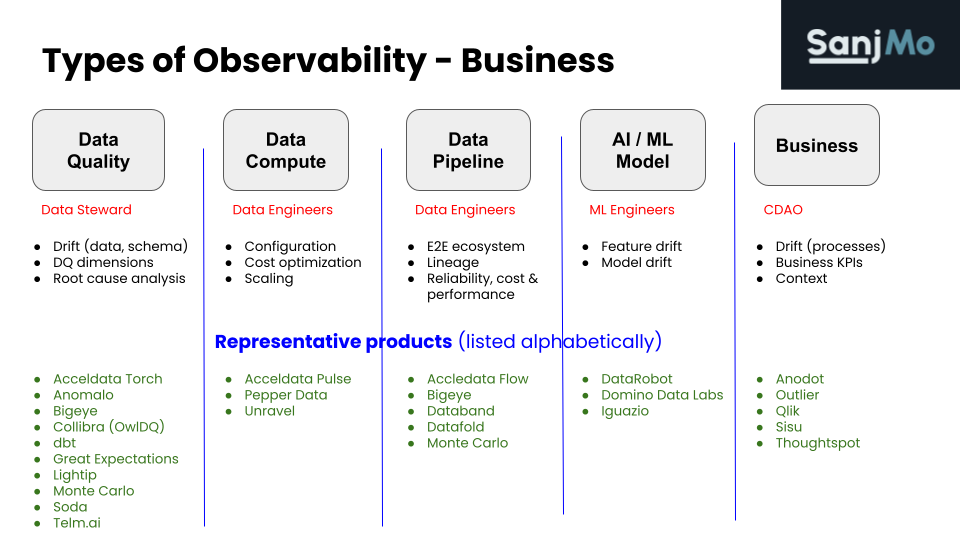
This report is focused on a few of the areas of Figure 1 that make up the “data observability” space, such as data operations, data quality, and data pipeline.
Data observability is the key to delivering data-intensive applications in the most cost effective and timely manner. It provides visibility into your data’s movement vertically and horizontally. The horizontal axis includes all the components involved across the entire end-to-end architecture — from data ingestion to data consumption. The vertical axis includes applications, data, and the infrastructure.
Data Observability Framework
Data observability sits in the overall DataOps workflow. In figure 3, data observability handles the first three boxes concerning identified significant events, raising necessary alerts and analyzing the causes.In the overall DataOps value chain, remediation steps would be initiated.

Figure 4 shows the major building blocks of a data observability framework. We will use this framework to build our evaluation criteria.

Figure 4. Data observability evaluation criteria
This report is geared for the practitioners, especially data engineering teams and their managers, who are the critical bridge between data producers and data consumers. Data engineers often are trying to keep up with the demands of ever-increasing data consumers and use cases. The last thing we want is for our data engineers to get burned out, and we don’t want to add the burden of trying to identify skilled talent in this competitive labor market. Ultimately, data observability provides life support to data engineers.
Data Observability Evaluation Criteria
Every evaluation criteria must start with understanding and defining one’s business requirements. These requirements should help create a baseline of must-have features. However, one needs to look past the current needs and anticipate future requirements. For example, your current requirement may be based on ingesting data from dozens of relational data sources and running heavy-duty night batch transformation jobs to create dashboards. But, in the near-future, you may be asked to migrate to a real-time streaming architecture with data science use cases. At that point, you don’t want to get a new data observability product.
Once you have created a requirement baseline, it is time to apply it against the categories mentioned in figure 1.
Data Sources and Collectors
The first area to consider pertains to the richness of supported data sources. Gone are the days when organizations had a handful of data sources and most of these were structured databases. Modern pipelines frequently connect to a few dozen sources that range from structured to SaaS applications to semi-structured or unstructured data.
If you were to issue a request for information (RFI), some questions should include:
- What data sources and destinations are supported?
- What data pipeline sources are supported?
- What compute sources are supported?
- How can new connectors be developed?
There are three types of sources which roughly correspond to data observability product use cases. Data sources connectors observe operational and analytical data sources in order to baseline data quality and usage patterns. Data pipeline sources are used to inform the data observability product on the data reliability aspects and finally, compute sources help understand the operational and, hence, cost and performance perspectives.
The most common data sources and destinations that the product should observe include:
- Data storage (Amazon S3, Azure Data Lake, Google Cloud Storage, HDFS)
- Operational and analytical data sources (structured RDBMS, semi-structured non-relational databases, and unstructured)
- Legacy sources (mainframes, COBOL Copybooks etc.)
- Files / unstructured data (using FTP / SFTP) and in common formats like JSON and Parquet
- SaaS data sources using APIs / GraphQL (e.g. Salesforce, Marketo)
Observing data pipeline sources is more complex than data stores. Older applications use proprietary drag-and-drop data integration tools, while many of the new applications just use code — Python, Java, Scala. Common data pipelines include:
- ETL / ELT (Informatica, SSIS, Talend, Pentaho, DataStage, Databricks Notebook)
- Data Transformation (dbt docs, Apache Spark, AWS Glue, Azure Data Factory)
- IPaaS metadata (Boomi, IICS, Mulesoft)
- Orchestration (Apache Airflow, Prefect)
- BI query logs (Tableau, Qlik, Power BI, Looker, Mode etc.)
Common compute sources are also less supported than the data sources. Some of the common ones include:
- Hadoop ecosystem (Apache Hadoop, AWS EMR, Azure HDInsight and Google Cloud Dataproc)
- Streaming data (e.g. Kafka, RabbitMQ)
- Enterprise architecture / data modeling tools (e.g. erwin)
- Machine learning models
An optimized built-in connector takes advantage of the sources’ architecture, such as parallelization. A generic connector may be just JDBC or ODBC-based, which may not perform very well. Source systems are generally bread and butter mission-critical systems that should not buckle under the weight of observation. Hence, it is important to understand the vendor’s connector strategy. Some vendors build their own connectors, while others OEM off-the-shelf ones.
The range of sources is very large, and no product will provide built-in connectors for every source. This leads us to evaluate the product’s ability to develop custom connectors. Evaluate the product for its strengths in a connector development kit (CDK). The CDK is like an SDK, with libraries for different languages that allow end users to build custom connectors. If the CDK is important to your use case, stress test it to identify the time needed and the ease of developing your connector.
Monitor and Measure Data Environments
The next evaluation criteria deals with monitoring. It starts with data quality, which is the most common reason for customers seeking data observability tools. However, the overall scope should also monitor how efficient and reliable the end-to-end pipeline is. Some questions you should seek answers to are:
- What are the data quality dimensions supported by the product?
- What is the scope of data pipeline monitoring?
- What is the scope of compute infrastructure monitoring?
- How are the monitoring tests developed?
Data quality is one of the most critical show stoppers of any data and analytics program. It has been an issue for decades, with a well-defined set of “dimensions” to monitor. A data observability product should support the dimensions mentioned in table 1.

Data pipeline monitoring is more involved as the product must first build a baseline and then inspect the logs to identify anomalies across various parameters, such as configuration, performance, and resource utilization.
The pipeline monitoring should include analytical execution environments such as Spark and Hadoop programs written in Java, Scala, Python, or others, and data transformation and orchestration engines. The monitoring process should identify source schema drift and potential impact on downstream systems.
Finally, infrastructure monitoring also first builds a baseline of resource utilization under normal load. The data observability product must alert when there are usage anomalies by translating the impact into cost increases. The product should predict infrastructure usage through the use of ML techniques.
Users should have the ability to customize monitoring through various approaches, including:
- User interface. A wizard driven approach to build tests with no coding required.
- Programmatically. A low-code approach to write code in a declarative language such as SQL or in other languages such as Python. Users should evaluate the sophistication of built-in functions and models. The tool should provide an ability to version control (e.g. in GitHub) the code. Finally, the entire functionality should be exposed through well-documented REST APIs.
- Configuration-based. Test cases could optionally be specified in YAML.
Finally, the monitoring should be continuous, and not just batch. Users should be able to manually trigger errors to simulate failure.
Analyze and Optimize Data Pipelines and Infrastructures
Monitoring the data, pipeline, and infrastructure continuously generates valuable metadata to diagnose issues, visualize the environment’s health, and provide recommendations that can optimize cost and performance. Evaluation criteria for this functionality of the data observability product should provide answers to the following questions:
- How detailed is the root cause analysis?
- What recommendations are provided?
- What is the level of remediation / resolution?
Root cause analysis of an issue should inspect the data’s state and its values, its environment, the pipeline it is a part of, and the infrastructure it runs on. This complete, multidimensional analysis is required to accurately pinpoint the cause of investigation. This complete picture is needed to provide a high level of confidence into the analysis.
Techniques used to perform the analysis should include a time-series analysis of the current data against historical data, and running machine learning algorithms, such as gradient boosting to predict behavior. Developing a fine-grained lineage can provide a deeper level of impact analysis.
A data observability product is not expected to remediate the identified causes, but it exposes its analysis through various means — log files and the management console. An advanced feature is when the product generates the necessary SQL statements to manually run against the underlying data.
Analysis of causes and issues is one side of the coin; the other side is the rich set of recommendations generated by the product. These recommendations should be made at technical and at business levels. At a technical level, the products should provide recommendations on right sizing of the infrastructure. At a business level, the recommendation should also include strategies for cost reduction.
Operate and Manage Data Operations
Incident management is responding to an unplanned event and restoring the service to its operational state. To perform effective incident management, the data observability product needs to generate alerts, collaborate with other teams, and integrate with other applications. The most successful products are the ones that reduce the number of steps and the level of complexity in managing incidents and restoring health while minimizing impact on business operations. The questions that your RFI should clarify include:
- What are the alert capabilities?
- What are incident management capabilities?
- What is the level of ecosystem integration, including dataops?
- How is collaboration achieved?
- How easy is it to use and manage?
Alerts in typical monitoring products are a boon and a bane. On one hand, they generate critical notifications of significant events, but so many alerts get generated the receiver is quickly inundated. The latter scenario leads to “alert fatigue.” Hence, evaluate the data observability product’s ability to group and prioritize alerts. The products should provide an ability to tune system or model sensitivity to make alerts more manageable. Finally, the product should provide a workflow for configuring notifications, such as priority, frequency, consumers.
Incident management capabilities include the ability to annotate lineage, provide feedback loop, and open tickets in the popular workload systems, such as ServiceNow, Jira, and other systems.
Data observability products are an integral part of a larger ecosystem. This ecosystem typically includes metadata management products, such as data catalogs and data quality products. Ideally, there should be connectors that facilitate the bi-directional exchange of metadata. For example, a data observability product may highlight data quality issues, which are remediated by the data quality product, and the catalogs on both the products are updated with the new state. Other integrations in the ecosystem could be with SIEM and dataops products.
Collaboration and crowdsourcing features complete the incident management workflow by permitting various users to participate in issue resolution. The feature should allow annotation of the lineage and integration with collaboration apps like Slack and Microsoft TEAMS. Users should be able to checkout and check in assets, endorse and certify them, or rollback changes.
Administration requirements are like any other enterprise application. For example, the product should provide automation, logging, audit, and backup support. Automation should span the entire observability pipeline, including inferring data quality rules and actions, detecting anomalies, and initiating remediation.
Usability is one of the most critical aspects to ensure adoption of data observability products. Evaluate the product on the ease of use for the features mentioned thus far. The product should allow the intuitive creation of workflows, besides providing built-in workflows for the most common tasks. More advanced capabilities include workflows specifically for vertical, industry-specific areas, such as financial services or healthcare.
Data Architecture
A well-architected data observability product seamlessly scales and performs in tandem with the growth in demand. From an end-user’s perspective, the underlying architecture details are not germane, as long as the product meets, or exceeds, its expectations. Key questions that should be answered include:
- What is the deployment architecture?
- How does the product scale?
- What are the supported certifications and security mechanisms?
Deployment architectures vary from on-premises to the cloud. Most organizations today have a significant on-premises footprint, while they migrate their data to one or more cloud providers’ data centers. Hence, the data observability product should provide hybrid multi-cloud support.
Cloud deployments also vary, from IaaS to PaaS to SaaS. The basic requirement is for the product to be installed in a self-managed (IaaS) manner in the major cloud service providers, such as AWS, Microsoft Azure, and GCP. More advanced products should be available as fully managed (PaaS), or even as serverless SaaS deployments.
The underlying architecture comprising the data discovery, classification, metadata store, orchestration engine, and analysis / search technology is important to determine the product’s agility in handling ever-increasing loads. Products that use open-source standards can benefit from new extensions and developments by the community. The goal of understanding the architecture is to ascertain its reliability and cost performance. There should be no single point of failure, and the architecture should enable scale out/in and scale up/down, with cost transparency. Finally, evaluate whether the scaling is automatic or manual.
Security evaluation criteria are paramount. All data in-motion and at rest should be encrypted. Products offered in the cloud as a SaaS service must have SOC certification. Other certifications may be required based on the industry verticals, such as HIPAA for healthcare, FedRAMP for government, and GDPR for the EU. Finally, access to the data observability product should use role based access control and integrate with the necessary identity and access management environment.
The Data Observability Market
So far, we have looked at the evaluation criteria from the technical features and functions angle. Now, we change tracks to examine non-technical evaluation criteria. This space concerns the overall market and individual vendor’s viability. As data observability is a relatively new space, these criteria become more critical than if we were looking to procure a new database management system.
As you evaluate the vendor, look at the pedigree of the founding team. Have they lived through the trials and tribulations unique to data engineers and, hence, particularly appreciate their pain points. Data engineers who have worked on an extreme scale realize the need for better observability. The questions we look to answer in this section of the evaluation criteria include:
- Why do customers choose the product and what are their use cases?
- How viable is the vendor?
- What is the pricing model?
- How sophisticated is the support?
Customer references provide a view of how well the product performs in production environments. Use-case driven evaluation should be preferred over one based solely on features and functions. Understand how many customers have deployed the solution you are evaluating, the time it took and overall customer satisfaction, or the net promoter score (NPS).
Identify the financial viability of the vendor by investigating their investment history, profits, revenue, and cash reserves. Often, the emphasis is on growth numbers, but equally important is the durability of the vendor. The goal of this evaluation criteria is to understand the maturity of the product, the vendor’s management team, and the robustness of the product roadmap.
Pricing models can be a stumbling block, or even a showstopper. The vendor should have a simplified, well documented pricing guideline. The pricing models may be based on the number of data sources, amount of data managed, the number of concurrent users, or the number of applications deployed. Ensure there is clarity on the upfront cost and the operating costs.
Finally, the support infrastructure is important for all products, but more so if the product category is new. Ensure that there is support in your deployment regions and in the language of your preference. Vendors should provide support for rapid prototyping to reduce the time to onboard the product. Investigate the existing support metrics, such as the number of tickets created, resolved, and the SLA levels. Support should span configuration, deployment, build and training.
Summary
Data observability tools have become must-haves for data-driven organizations struggling to deliver timely insights. These companies understand the power of data to deliver not just intelligence, but competitive advantage. However, without transparency into the validity of data and the reliability of data pipelines, the best laid plans go awry. If your monitoring software bubbled up known knowns, data observability products help unearth unknown unknowns. This document provides an evaluation criteria to select a data observability product that best meets your business and technical requirements.
To see data observability in action, get a demo of the Acceldata platform.
Photo by Krissana Porto on Unsplash


