.svg)


Enterprises that want to achieve complete visibility across their data environments need the benefit of data observability in order to achieve data quality and reliability at scale. Acceldata’s integration with Databricks gives users the most comprehensive operational observability into their Apache Spark deployments.
Databricks is the de-facto cloud platform for Spark that allows users to manage clusters and deploy Spark applications in cloud environments. It’s a flexible platform, and supports the launching and managing of Spark clusters on all three major cloud platforms.
Spark is an open-source unified data analytics engine for large scale data processing. When used correctly Spark provides the most expressive Scala / Python) and simple (spark-sql) way of working with petabyte-scale data.
Spark is a distributed data technology and cluster configuration has a massive impact on job performance. Unless you are a Spark expert, there is no easy way to find out how to configure your cluster and job to maximize performance.
Poor performance can also increase your cloud costs.
Acceldata’s Databricks integration with Pulse helps you observe your cluster and the performance of your jobs. Acceldata Torch helps you implement data reliability techniques for Delta Lake. In this post, we’ll show you how you can deploy Acceldata to your Databricks cluster and derive important benefits, including:
- Understanding your cluster and applications
- Debugging and fixing performance issues
- Finding root cause analysis (RCA) for failures
- Improve data reliability using Torch for Delta Lake, an open source storage layer
Step 1 - Deploy Pulse to your cluster
Deploying Acceldata to Databricks is a managed and fully automated process. Once the integration is complete, Pulse will install an agent into Databricks which will help Pulse hook into Databricks and Spark internals, and once completed, that’s it, you don’t need to do anything else.
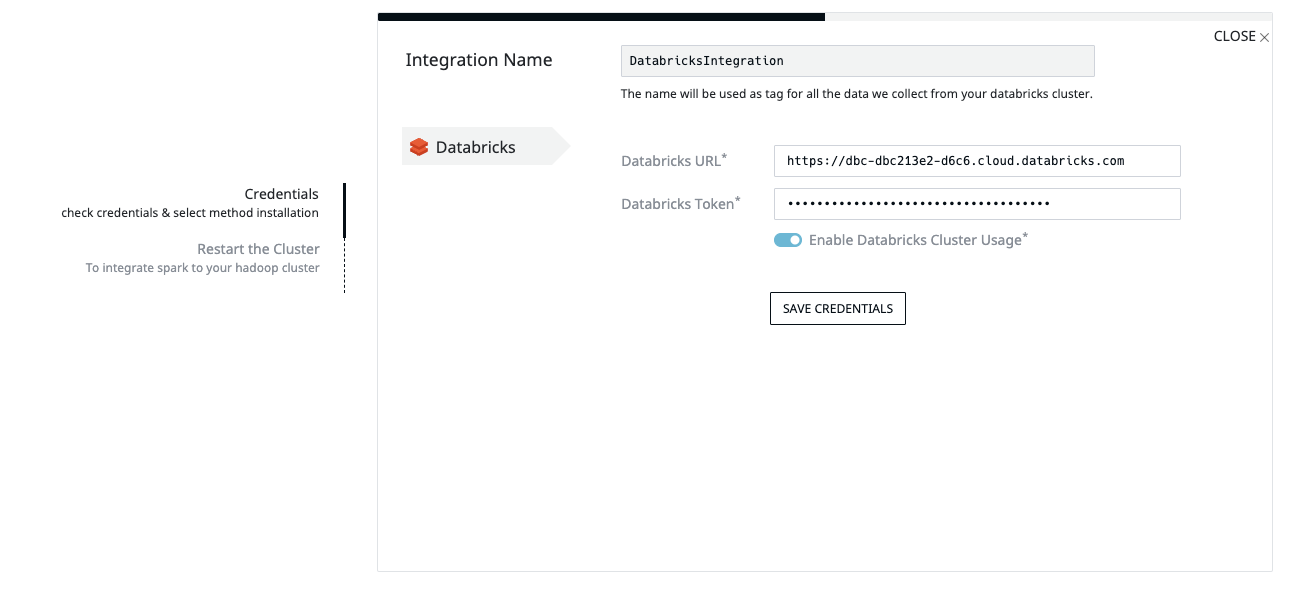
You can choose to restart any long-running clusters to apply the Acceldata agent to existing clusters as well.
Step 2 - Understand your cluster
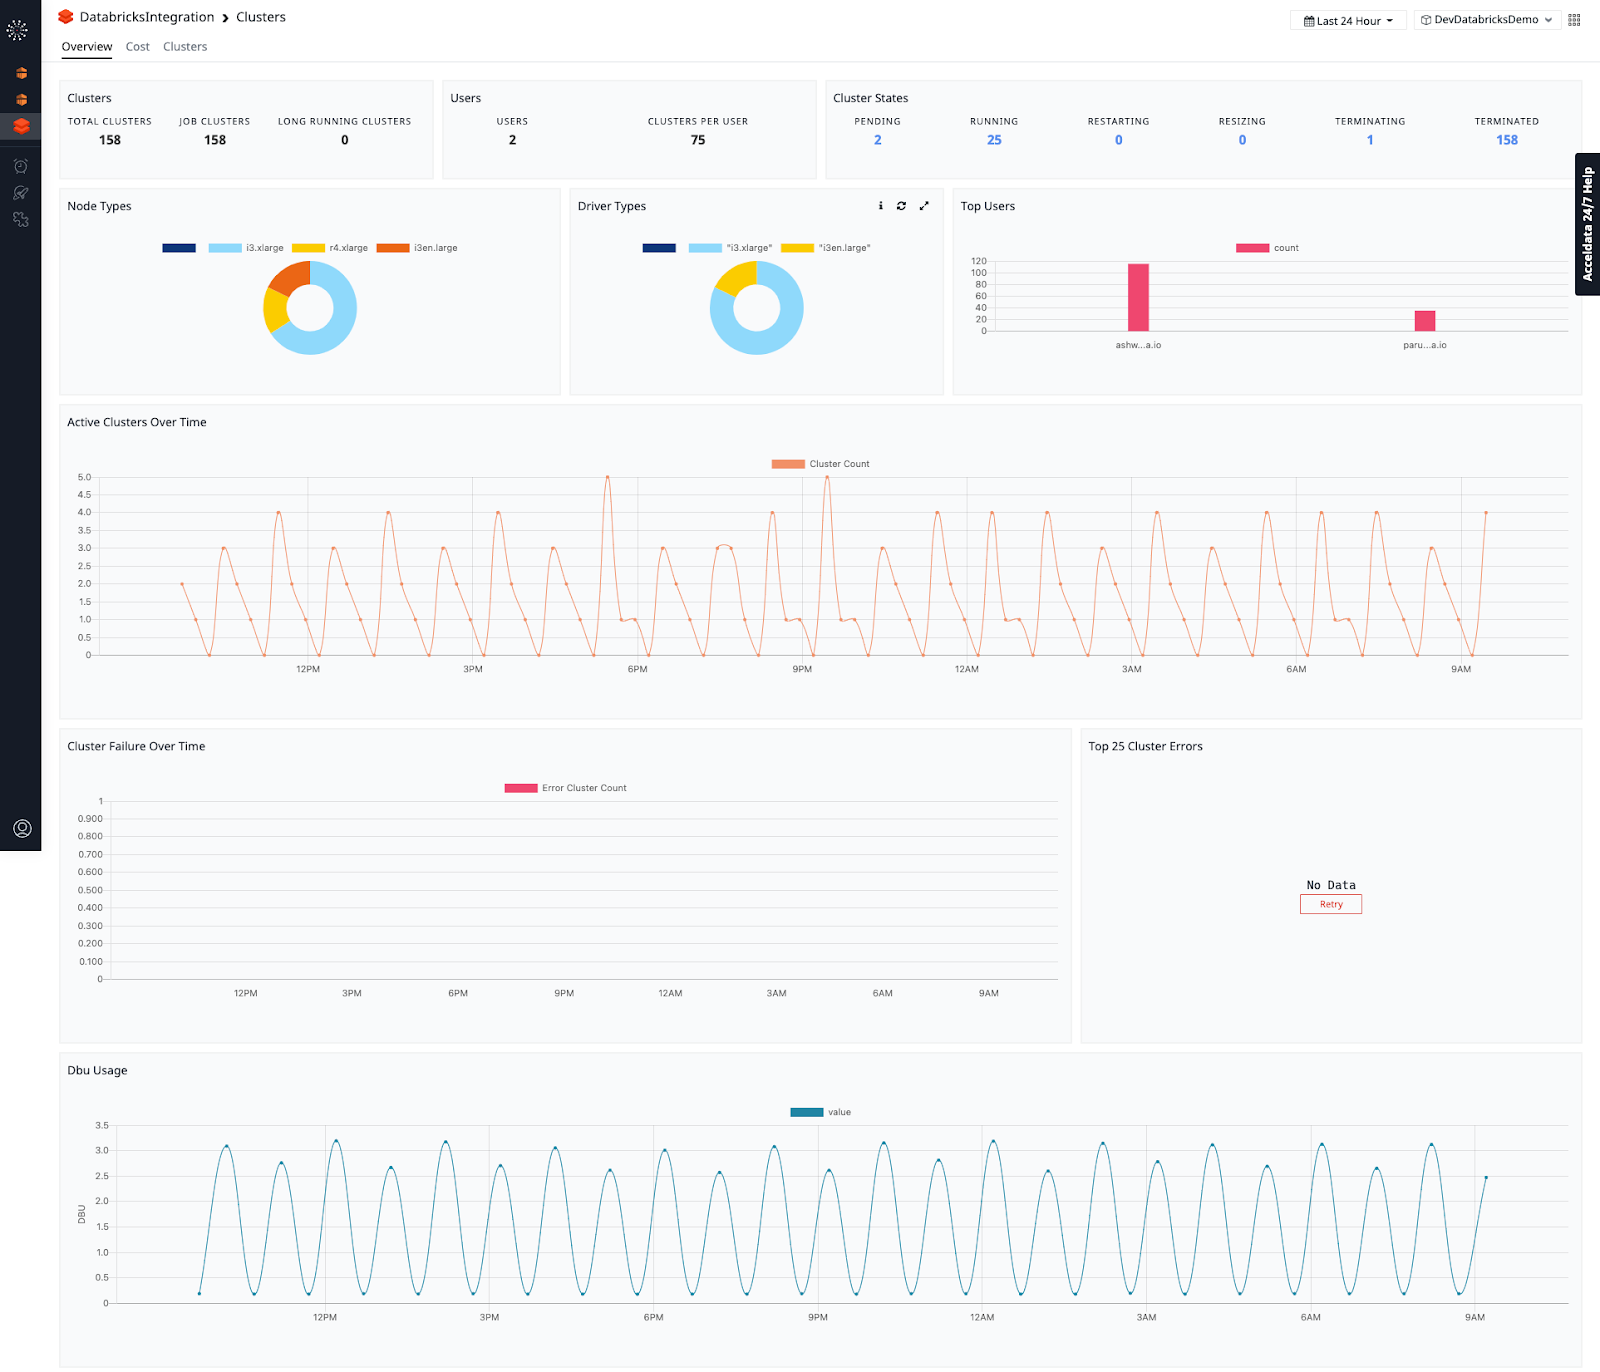
The cluster overview section provides useful information with respect to your overall cluster footprint, including data around cluster types, states, cluster count, top users, number of clusters. You can even create and pin visualizations to monitor cluster usage and errors.
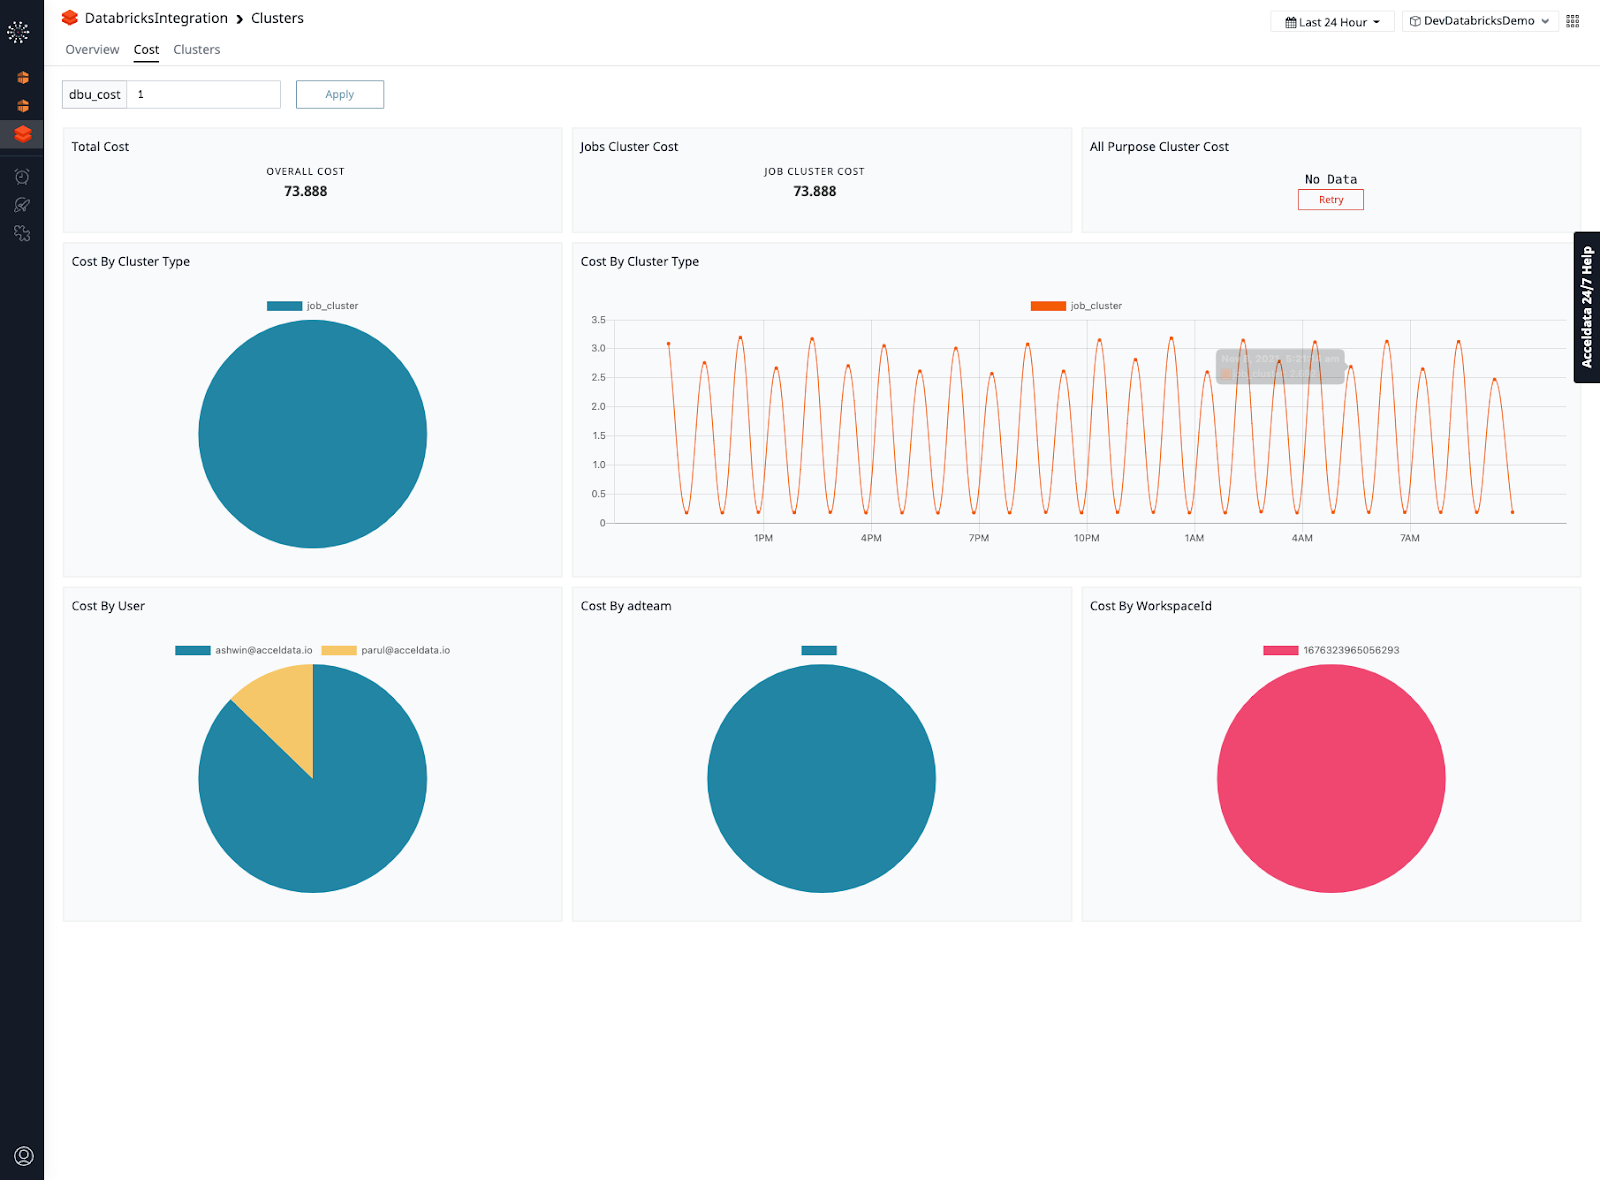
Pulse can also proactively monitor costs related to running Databricks clusters. You can use custom tags in Databricks to slice data into departments or cost centers, or even different users.
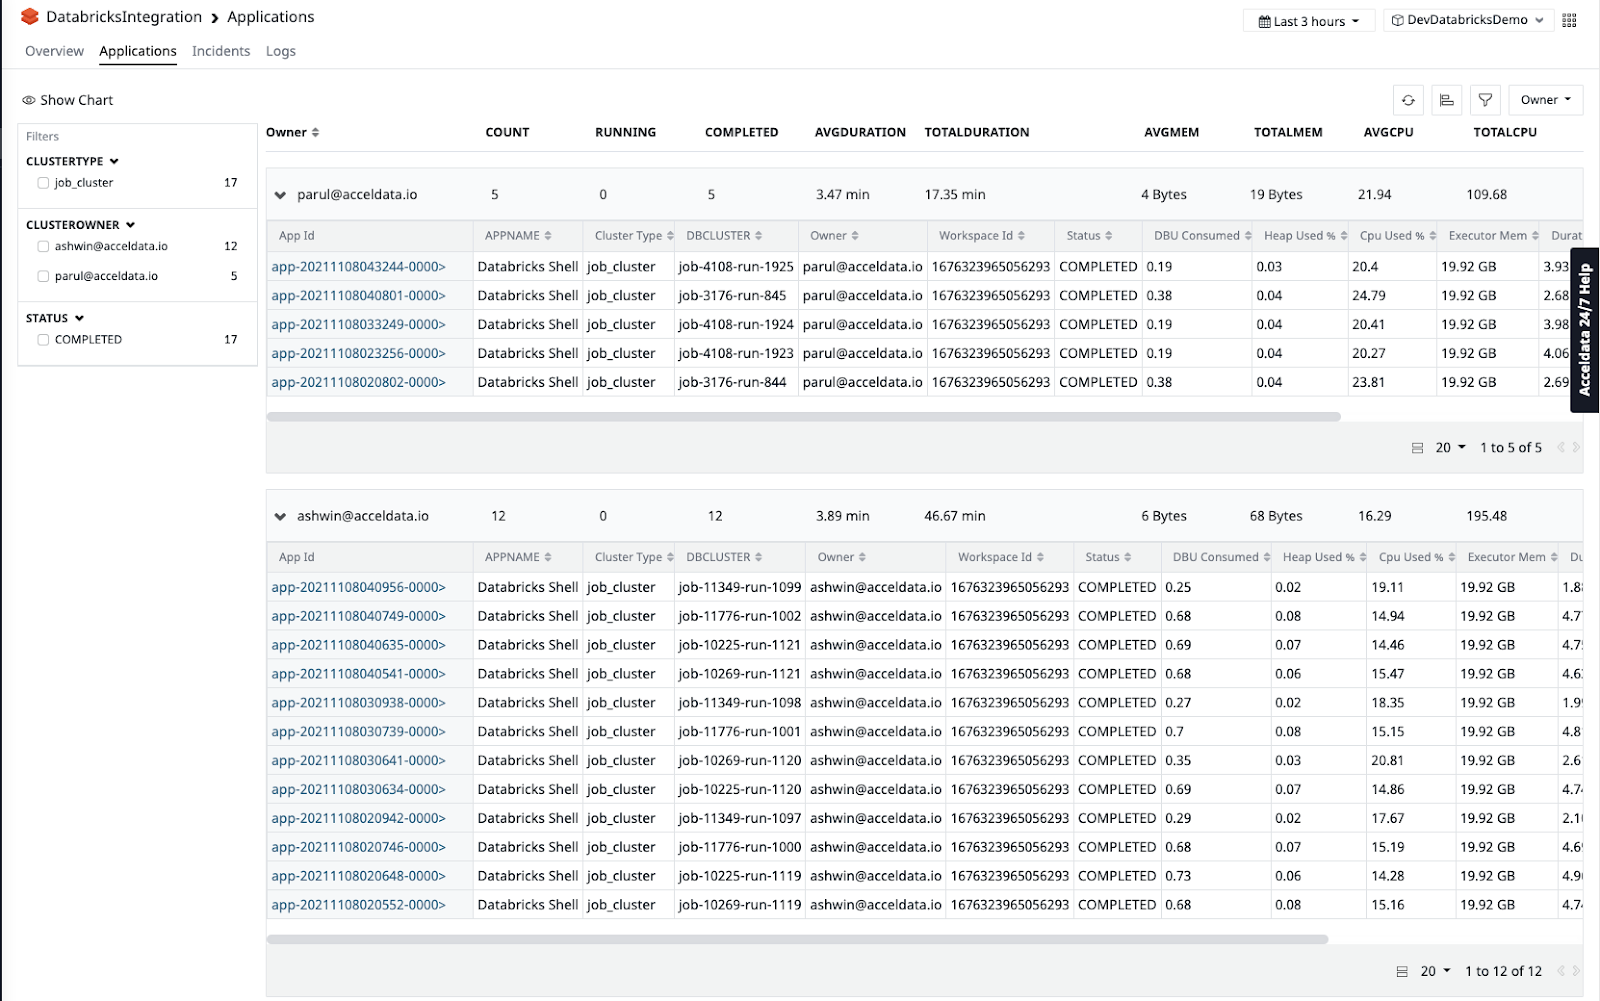
Step 3 - Understand your applications
Pulse provides a simple list view mechanism to slice and dice your applications. You can even design your own filters and grouping mechanisms. This makes it easy to find the types of applications you wish to debug
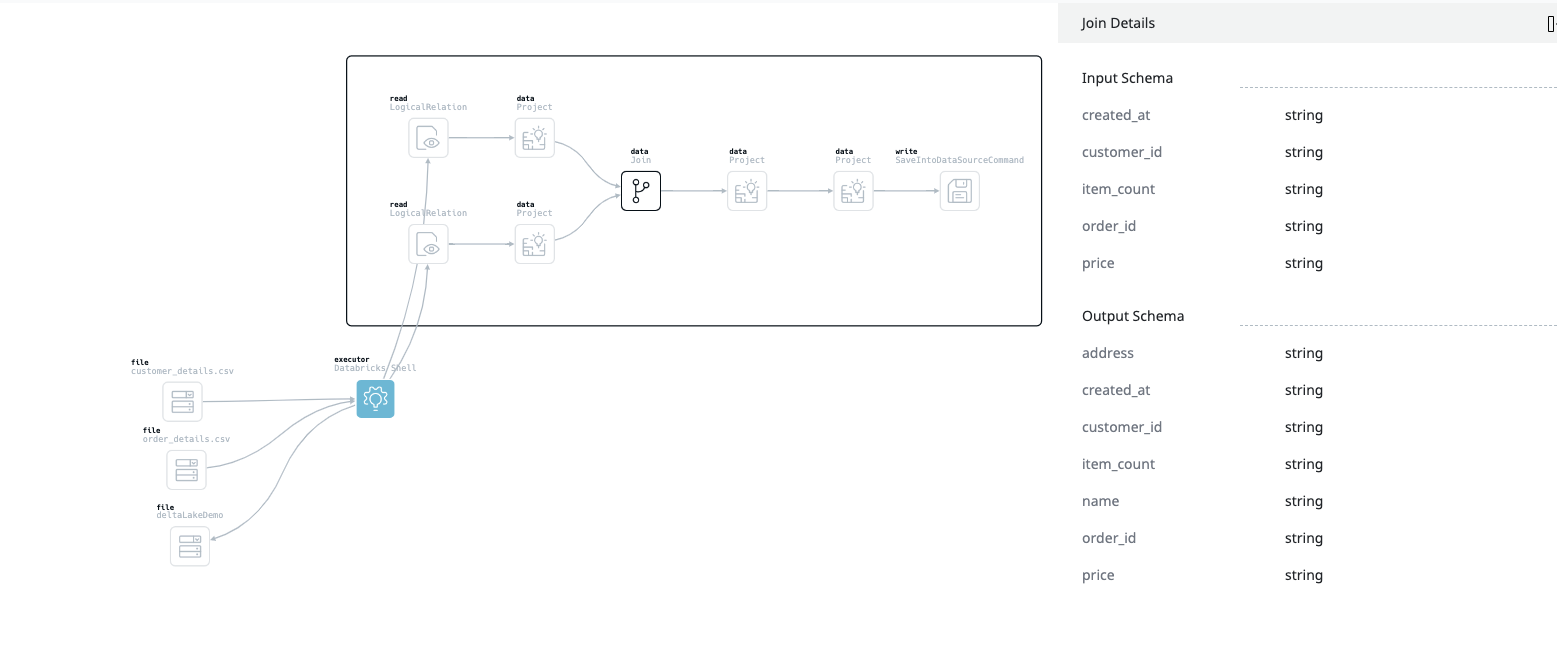
Spark jobs can be complex. With larger data engineering teams contributing code over time it becomes difficult to understand what the job actually does. Pulse provides you with a comprehensive graph view that describes exactly what the job was designed to do and all the different steps it takes to perform its tasks.
The Pulse agent attaches a custom listener to every Spark application which allows it to understand every data source, data transformation, and sink used in an application. This is invaluable if you are using Spark as an extract, transform, load (ETL) engine
Step 4 - Debug your applications
In addition to cluster, cost, and application information, Pulse also collects metrics and performance-related data which allows you to track job stability and performance.
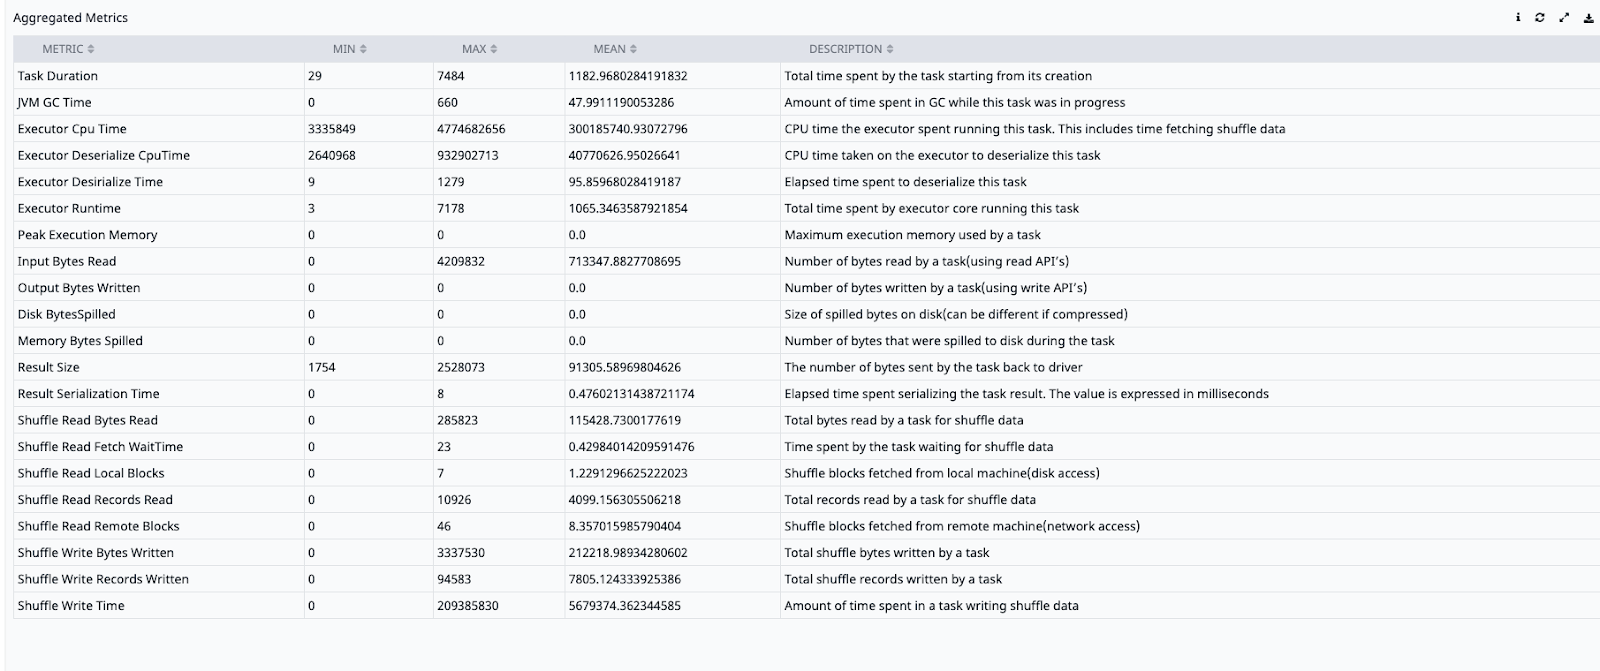
Along with the status of the application, it’s important to monitor resource metrics at the stage level to understand how Spark is processing your data.
A Spark application is split into tasks which are further broken down into stages that represent a set of similar computing tasks needed to run a job. This is organized by the driver node for parallel execution across worker nodes. Each worker node stores a chunk of your data to process as a partition. When data from different workers are needed, Spark initiates a shuffle operation.
Knowing which stages are performing poorly compared to others is key to optimizing performance. Pulse provides a stage-by-stage breakdown sorted by time taken and detailed metrics related to each stage.
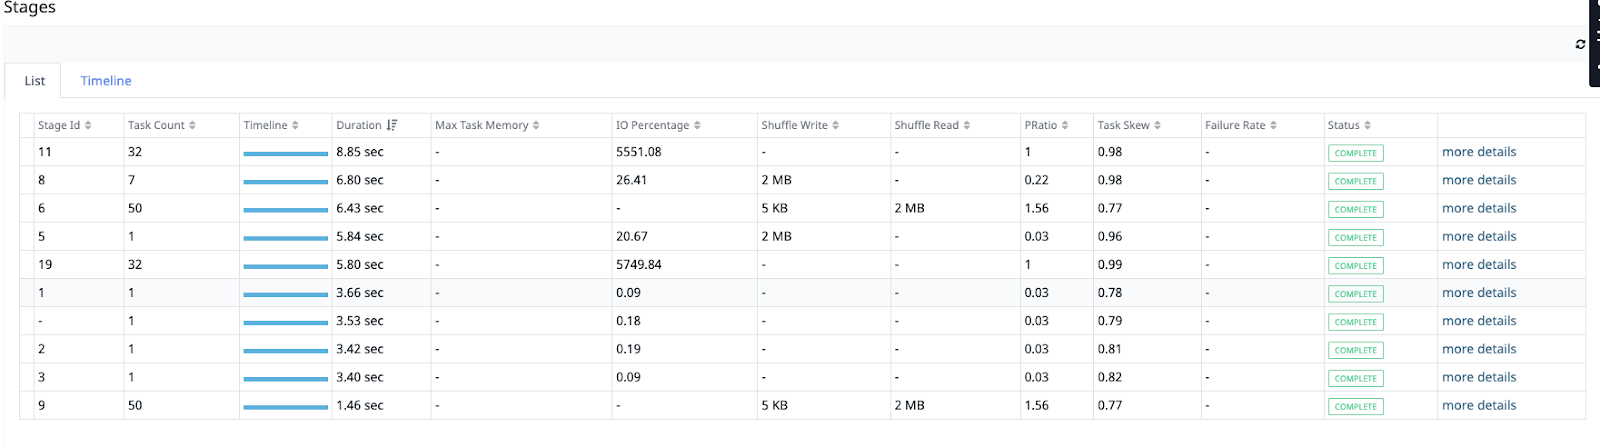
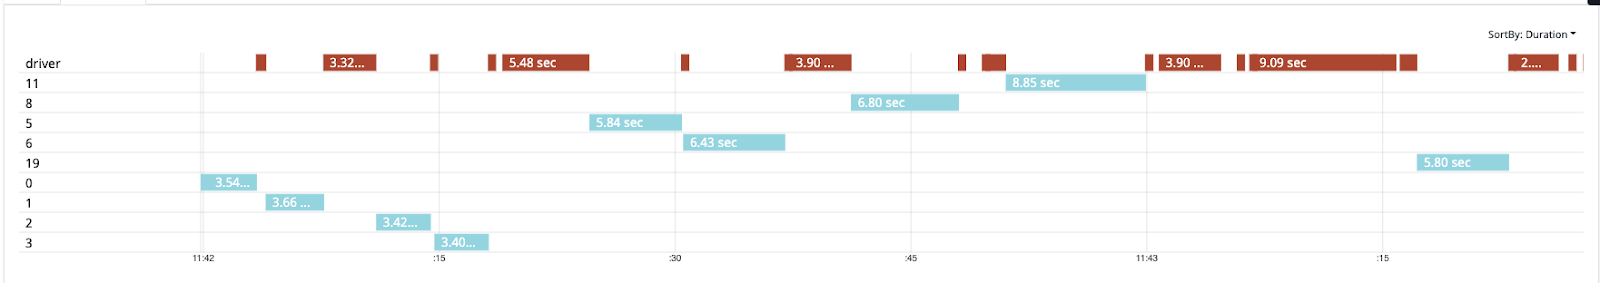
Shuffle operations are particularly expensive because they require copying data across the network between nodes. To optimize performance you need to understand the different metrics which Spark generates.
Step 5: Use alerts and logs to dig deeper into applications
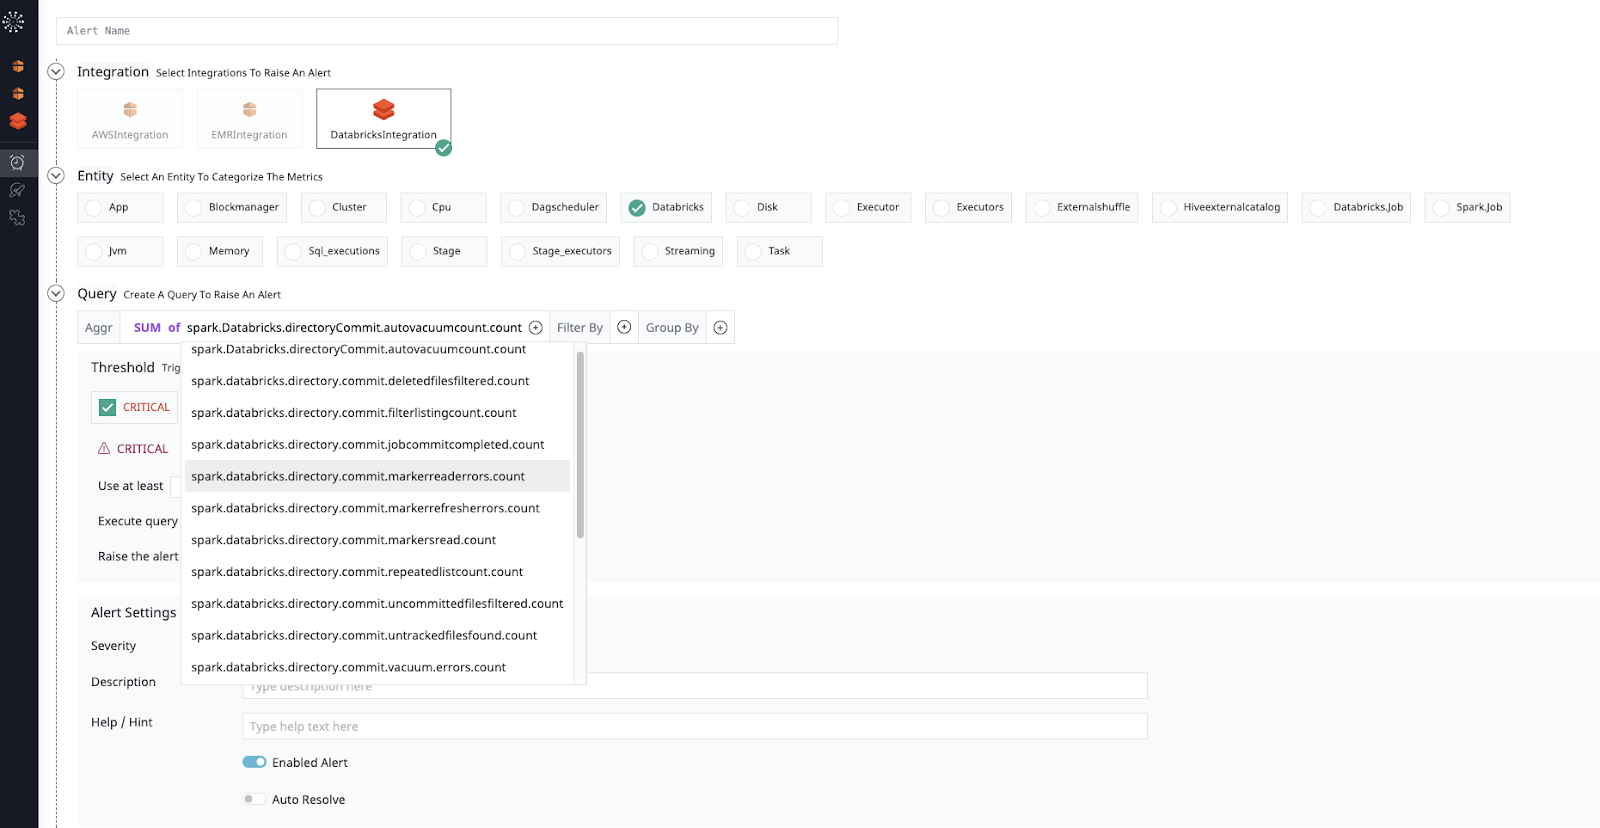
Pulse ships with a powerful alert engine that can be configured to alert users on a wide range of metrics and values, even logs. For example, you can create alerts when application stages are taking too long, or if the garbage collection (GC) cycles take longer than expected, or the application is suffering from too much shuffle.
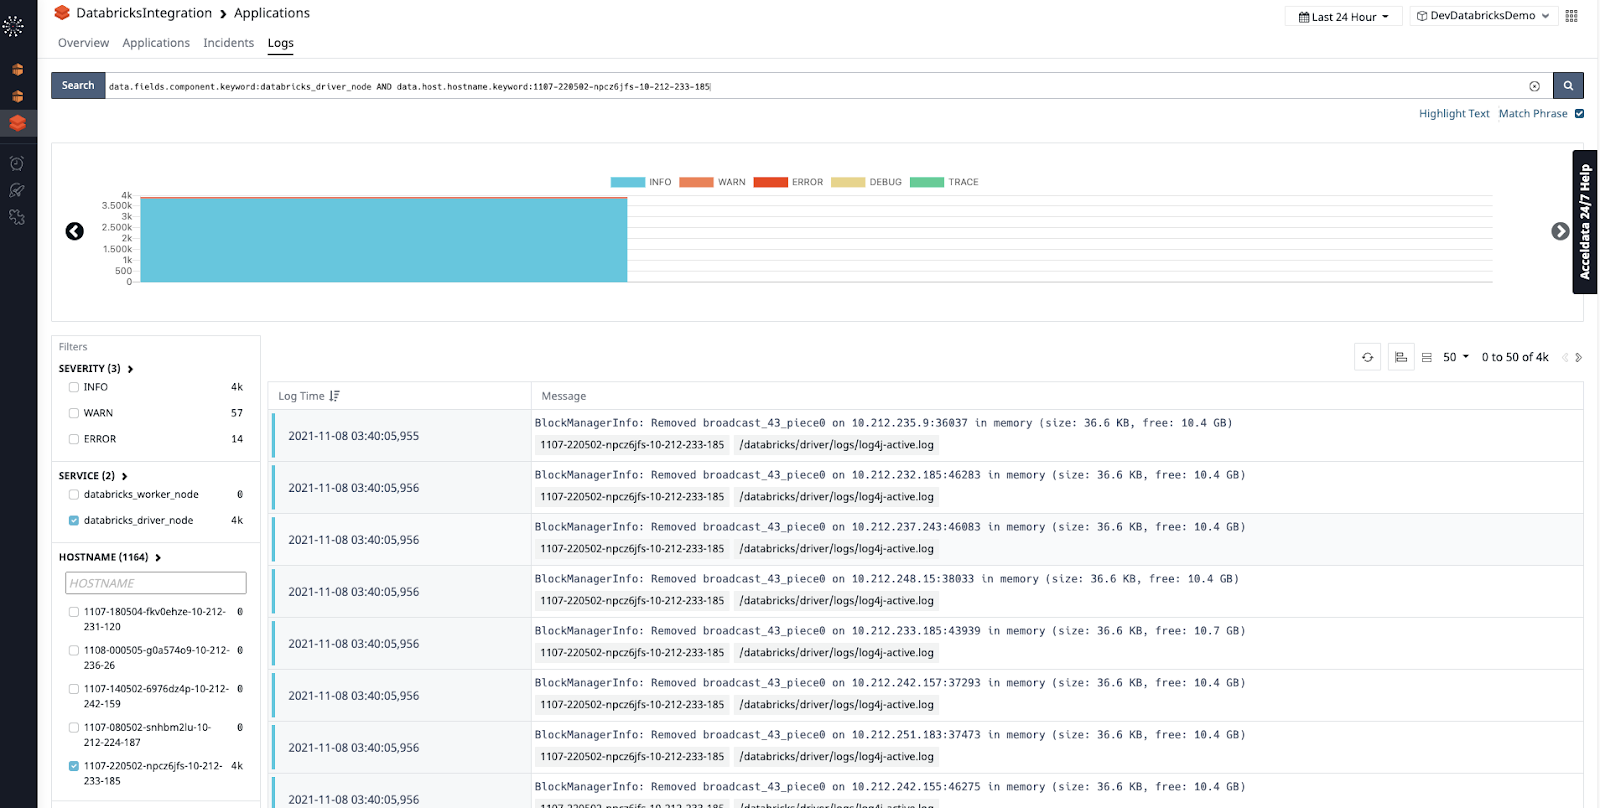
Pulse also collects real-time logs from your Databricks clusters which can provide additional context that can help you troubleshoot issues. Pulse can be configured to ingest driver and executor logs and even system logs from your infrastructure nodes.
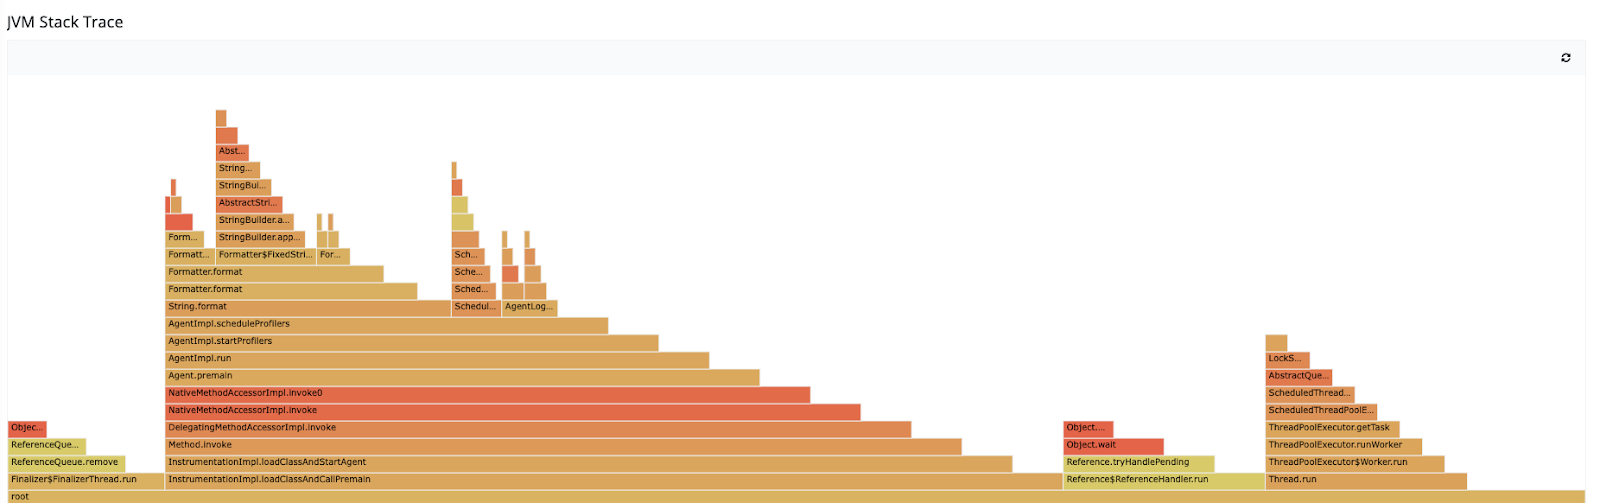
Pulse also generates a complete Java Virtual Machine (JVM) flame graph which allows you to observe what’s happening inside the JVM and which methods are the hottest and which call chains are taking up the most time.
Step 6 - Implement data reliability for Delta lake
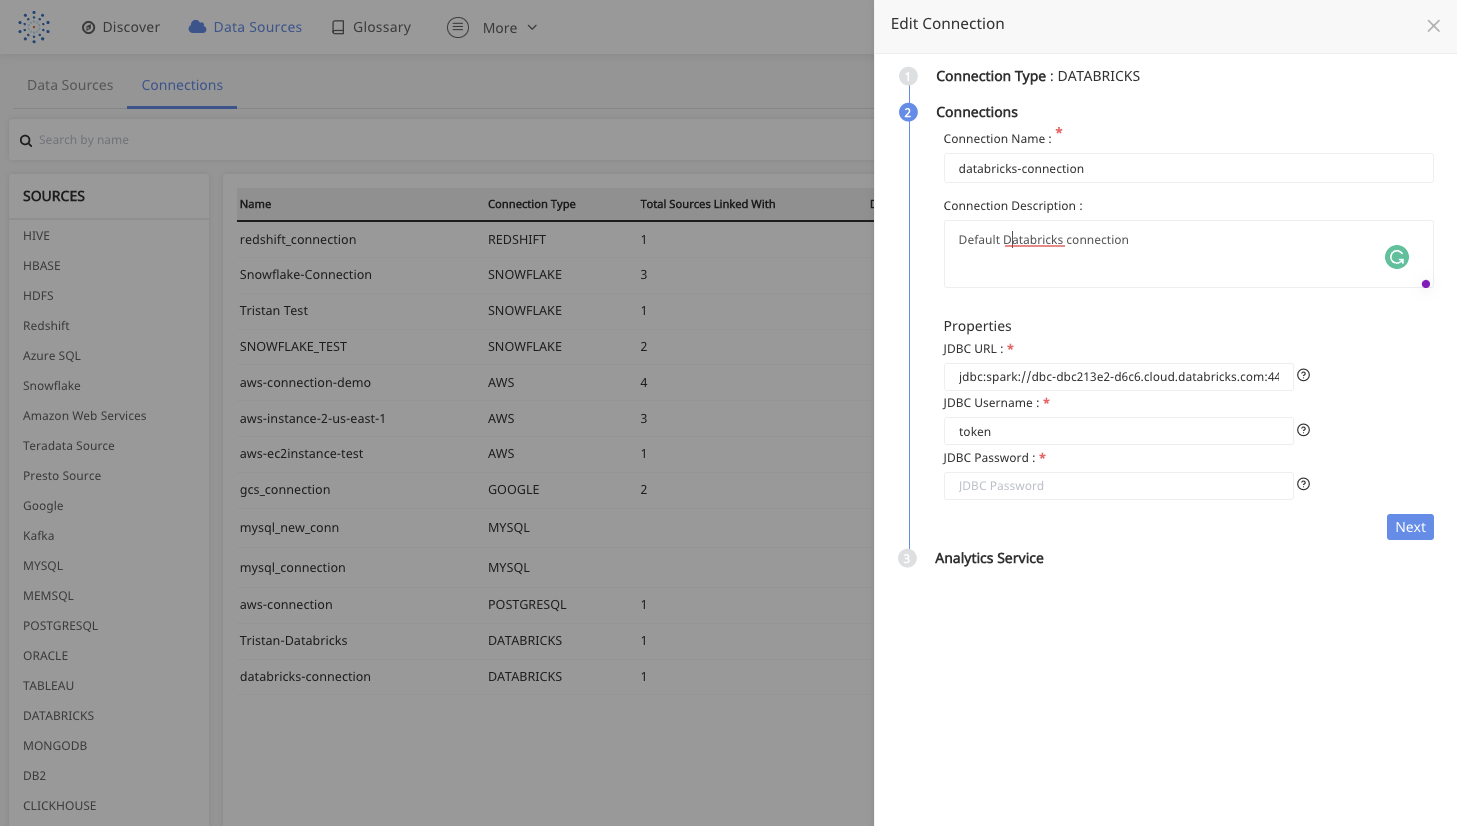
Once you understand the Databricks Spark cluster and application performance, you should also make sure that the data you process through your Spark jobs is reliable. Acceldata Torch supports more than 30 data sources including S3, GCS, and Delta Lake. To implement data reliability on Delta Lake, add the Delta Lake JDBC connection using the Torch data sources wizard.
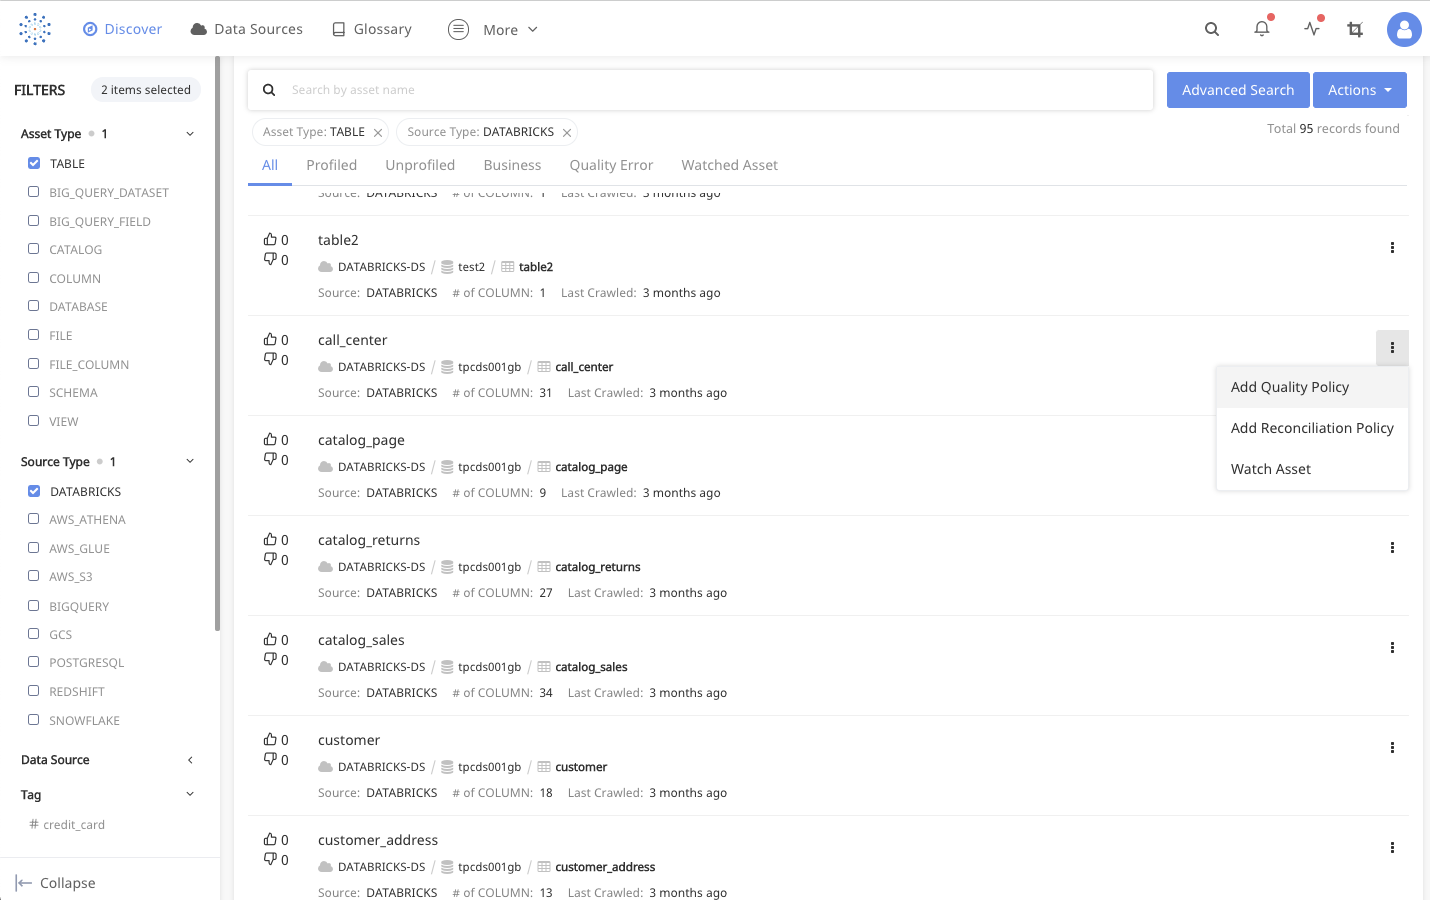
Torch will crawl and index all data assets in your Delta Lake instance. The Torch crawler adapts automatically to your schema changes and will update its internal state as you create/update/ delete tables in Delta.
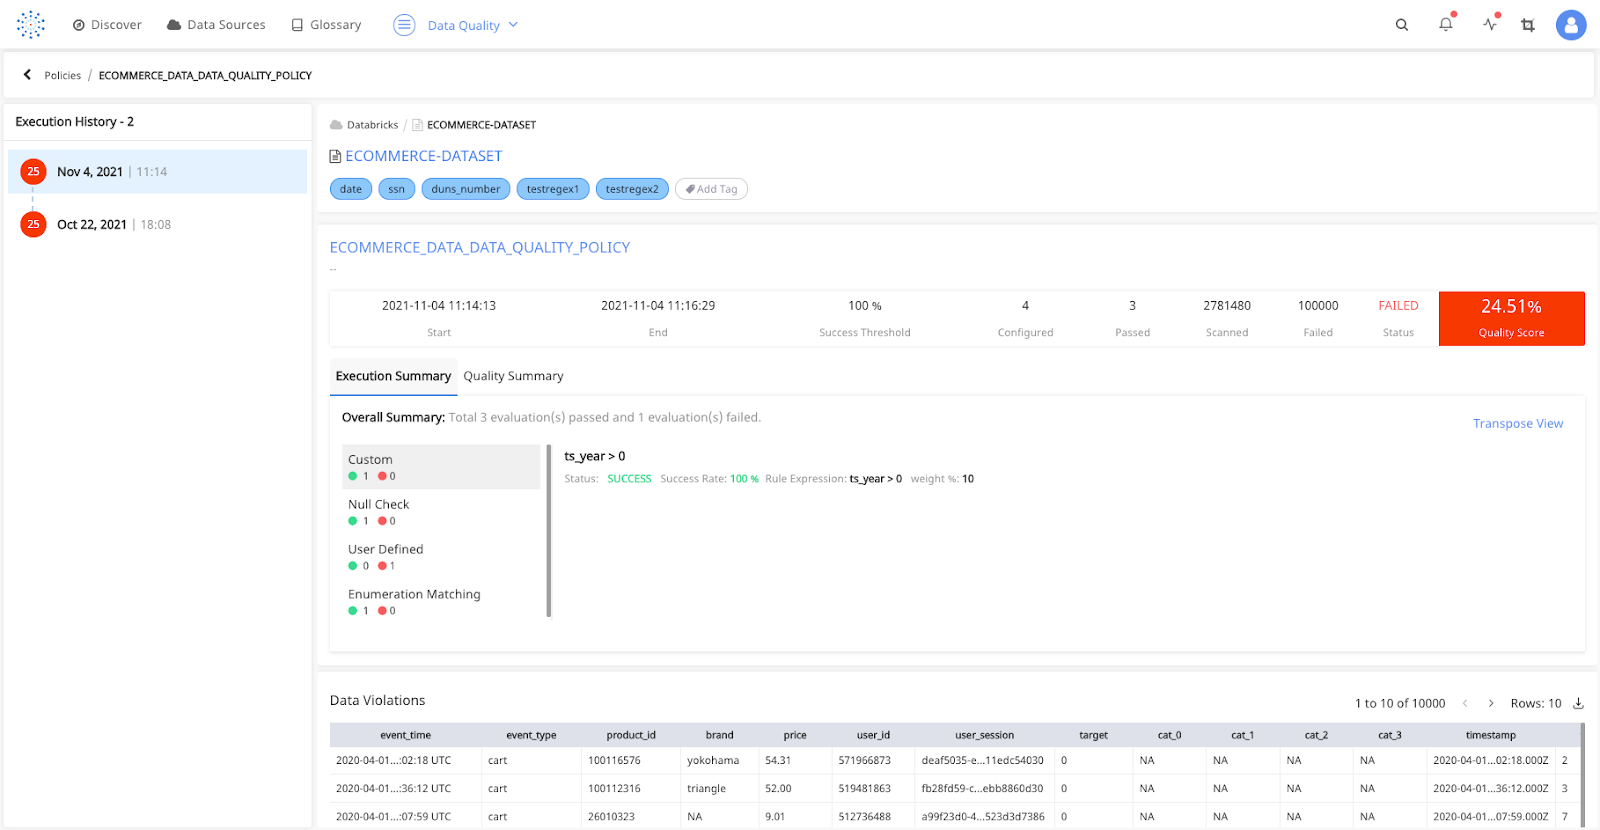
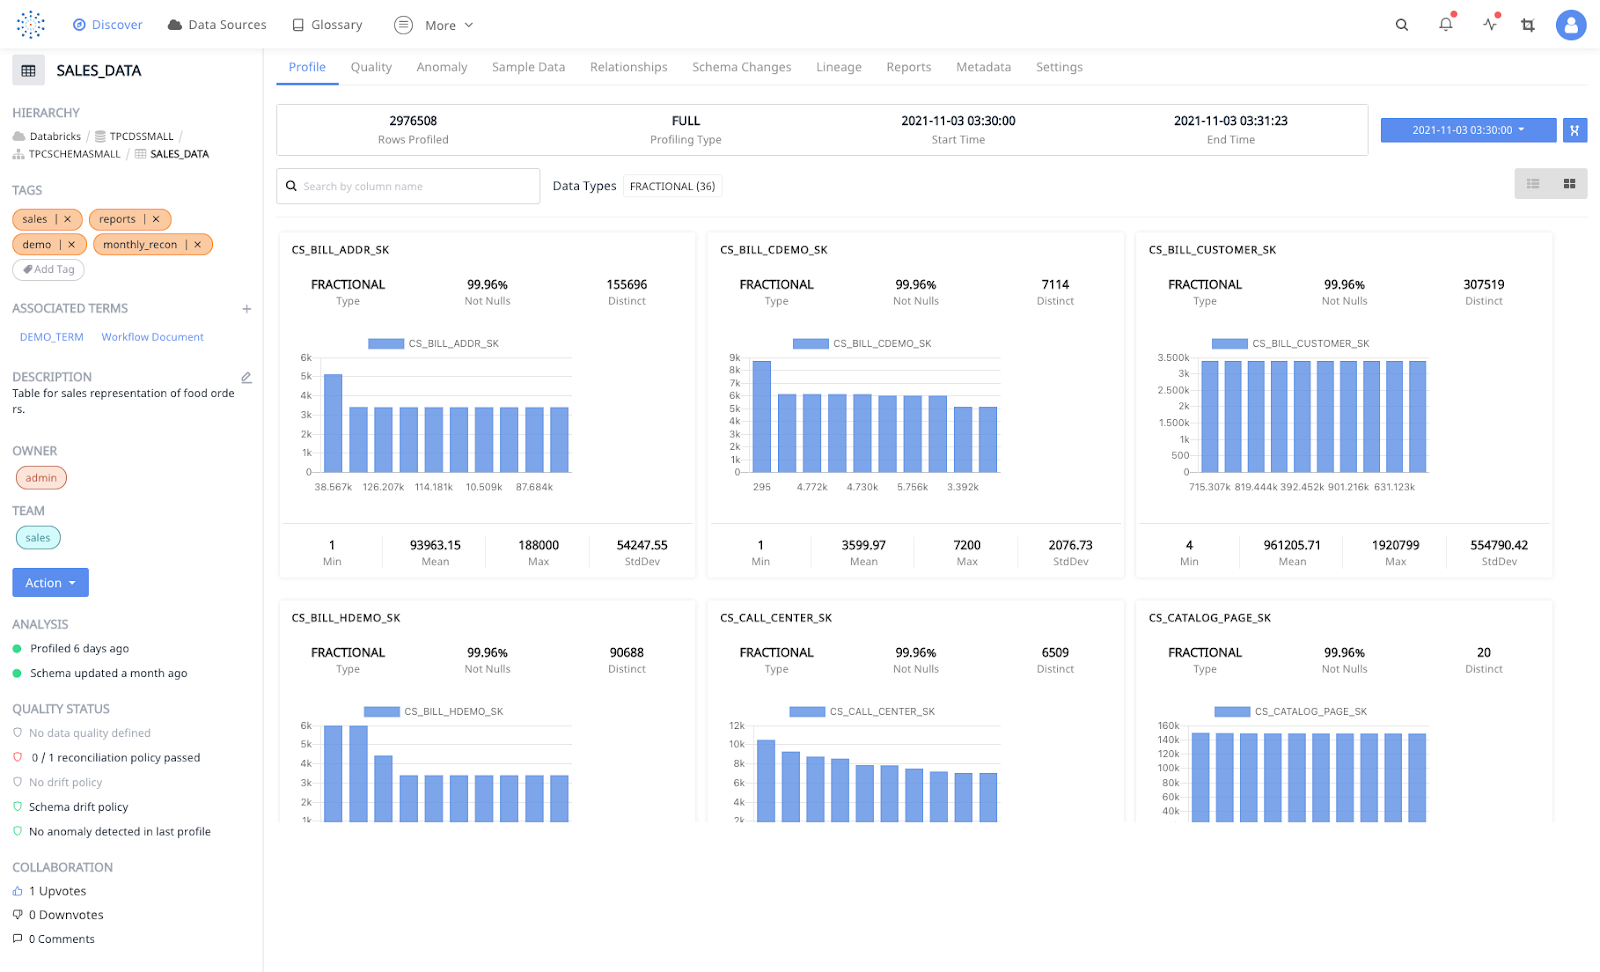
Torch can automatically detect and profile the most used tables in Delta Lake. This configuration can also be changed to manual profiling. Profiling the data helps you understand the data distribution across the columns. Torch is built to scale with your data, In this example, A data profile for three million rows was built in 90 seconds.
Once your data profile is built. Torch will automatically start detecting anomalies in your dataset. You can also apply data quality policies, data reconciliation policies, detect schema drift and data drift, inspect data lineages, and much more
Use data observability for Databricks
Acceldata’s integration for Databricks provides multi-dimensional data observability into your Databricks clusters so you can ensure data reliability at scale. Request a demo of the Acceldata platform.