


.svg)


Broken dashboards are every BI Analyst’s worst nightmare. They erode trust, waste valuable time, and can steer decision-makers in the wrong direction. The problem? Most data observability tools react too late—only alerting you after the dashboard is already broken and users are already questioning the numbers.
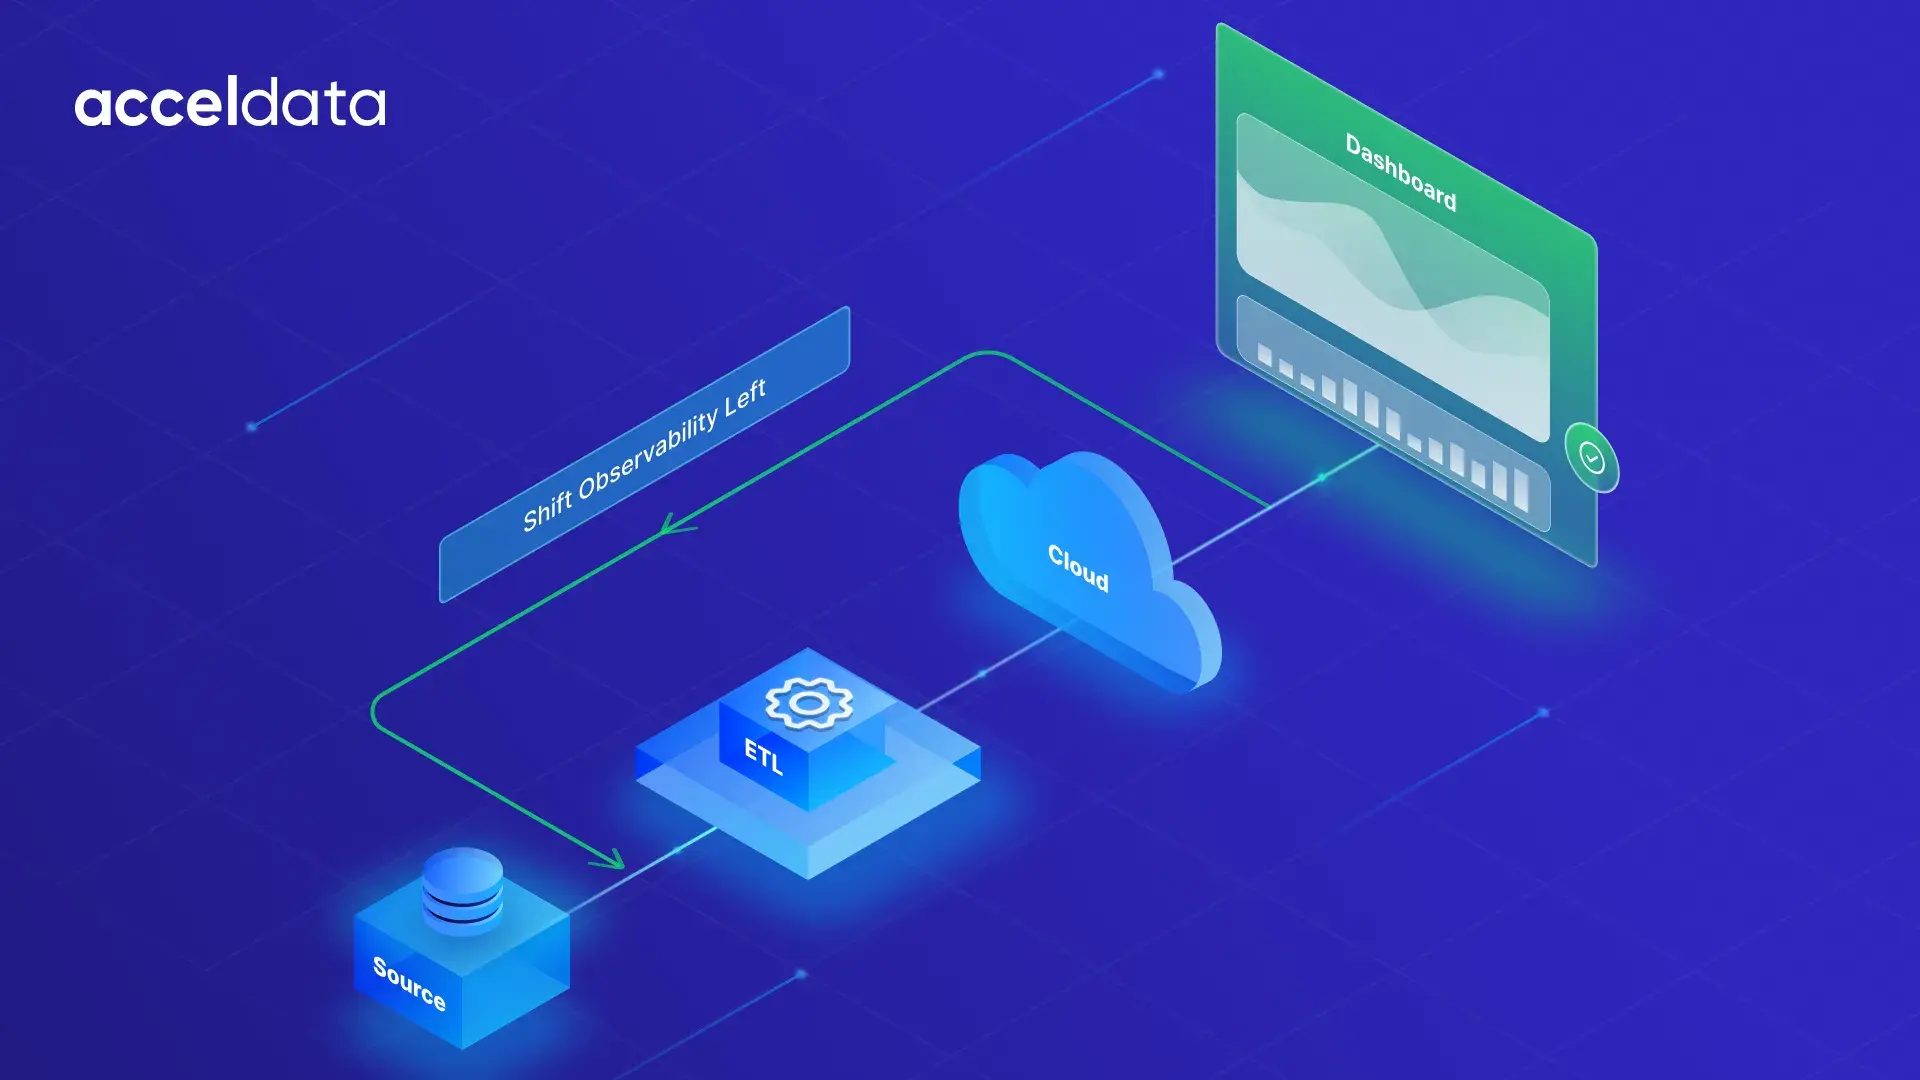
The smarter approach is Shift-Left Observability: catching and fixing data issues at the source, before they cascade into reports, KPIs, or visualizations.
At Acceldata, we help BI teams move observability closer to the source — empowering them to detect anomalies, schema drifts, and freshness gaps much earlier in the pipeline, ensuring that dashboards load with the right data—every time.
What Does “Shift-Left” Mean for BI and Data Observability?
In data observability, “shift left” means moving data quality checks, monitoring, and issue detection as early as possible in the data pipeline—right from the landing zone where data is first ingested or transformed.. Instead of waiting until data lands in your dashboards to find out something’s wrong, shift-left observability embeds checks and monitoring from the very beginning.
This proactive approach for BI means catching data quality issues, schema drift, or pipeline failures before they disrupt your analytics and dashboards.
How Acceldata Makes Shift-Left Observability Work for BI
Acceldata’s shift-left approach integrates observability and data quality checks at every stage of your data pipeline—from ingestion and transformation to final consumption.
1. Detect Problems Before They Reach Power BI or Tableau
BI tools show what’s in your warehouse — but they can’t tell you if it’s right. With shift-left observability, Acceldata enables:
- Automated checks on freshness, completeness, and schema drift at every pipeline stage
- Real-time data trust scores embedded in dashboards
- Early alerts for nulls, anomalies, and broken transformations
Result: You don’t just catch errors. You prevent them.
2. End-to-End Lineage: Trace Every Metric to the Source
When KPIs look off, it shouldn’t take hours—or guesswork—to figure out why.
With Acceldata, BI analysts and data engineers get shared visibility across the entire data lifecycle, making it easy to trace issues across tools, systems, and teams.
What Acceldata Enables:
- Visual lineage through pipelines to BI tools (Power BI, Tableau, Looker, etc)
- Interactive drilldowns to trace metrics, fields, and transformations across every layer
- Instant identification of where changes or errors originated — schema changes, delayed pipelines, stale data, or broken joins
Result: Investigate issues in minutes—not hours—and respond with confidence.
3. Pushdown and Scaleout: Choose the Right Performance Model
Most data observability platforms lock you into a rigid architecture. Acceldata takes a different approach—offering BI and analytics teams the flexibility to choose how and where observability workloads run, so you can meet both performance and cost goals.
Why it matters for BI teams:
- Pushdown mode executes data quality checks inside your data warehouse (e.g., Snowflake, Databricks, Redshift). Ideal for moderate data volumes.
- ScaleOut mode runs observability jobs on a separate compute layer—ideal for isolating heavy workloads or managing multi-cloud complexity.
Result: Acceldata offers a flexible deployment model forfast, reliable insights without compromising on performance.
4. Data Trust, Right Inside the Dashboard
Let your dashboards do more than visualize — let them communicate trust.
With Acceldata, data quality isn’t hidden behind the scenes. We embed trust indicators directly into BI tools like Power BI, Tableau, and Looker—so analysts and business users instantly know if data is reliable.
What Acceldata Enables:
- Real-time freshness indicators and anomaly warnings shown directly in the dashboard
- Embedded data trust scores alongside KPIs to highlight confidence levels
- Pipeline context overlays to show whether upstream jobs ran successfully or failed
Result: Fewer escalations. More confident decisions. Stakeholders trust the story your dashboard is telling—because they can see the health of the data behind it.
5. Stop Firefighting. Start Forecasting.
Shift-left isn’t just about early alerts—it’s about giving BI teams control over data reliability before it becomes a problem.
With proactive observability from Acceldata, you can:
- Reduce dashboard outages, broken visuals, and last-minute escalations
- Free up analysts from manual data checks and constant triage
- Build trust with business stakeholders through consistent, accurate reporting
Result: Your BI team becomes a strategic partner. With fewer surprises and more stability, analysts can focus on delivering insights that move the business forward.
Why Competitors Fall Short
Most data observability platforms focus on monitoring data after it’s already in your systems or dashboards. This reactive approach means you only find out about problems when your users do—leading to fire drills, lost trust, and costly fixes.
Unlike reactive platforms, Acceldata brings data observability to the left side of the pipeline—at ingestion, transformation, and orchestration layers. This means issues are caught and resolved long before they impact your dashboards or decision-makers.
Broken dashboards aren't just a BI problem—they’re a pipeline problem. Acceldata fixes them at the source.
The Benefits of Shift-Left Observability for BI Analysts
- Proactive Issue Detection: Identify and resolve data issues before they impact your dashboards. This means fewer surprises and less time spent troubleshooting.
- Improved Data Quality: High-quality data is built into your pipeline from the start, resulting in more reliable and trustworthy analytics..
- Faster Problem Resolution: Catching issues early means they’re easier and cheaper to fix, reducing downtime and frustration for your team and users..
- Cost Efficiency: The “1 x 10 x 100 rule” applies: fixing a problem at the source costs $1, fixing it downstream can cost $10 or even $100.
- Enhanced Trust and Reliability: When your dashboards are always accurate, your stakeholders trust your data—and your team’s work.
Shift-Left Observability: The Future of Reliable BI
Your dashboard is only as good as the data behind it.
By shifting observability left, Acceldata helps BI teams trust, validate, and scale their analytics — without the chaos of last-minute fixes or broken visuals.
Ready to shift left? Book a demo and see how Acceldata powers trusted dashboards—before they break.


