


.svg)


Data processing with Spark is all about the performance of your infrastructure. The key to getting the most out of Spark is being able to monitor it. While there are multiple ways to monitor Spark including web UIs, metrics, and external instrumentation, many companies are beginning to run Spark on Kubernetes which opens up new avenues for monitoring.
Spark on Kubernetes became generally available with Apache Spark 3.1, released in March 2021, making it important to understand how to monitor Spark on Kubernetes as more companies adopt this approach.
Pulse integration with Spark provides an overview of the Spark jobs, job status, and other metrics such as memory usage in applications. Pulse allows you to build dashboards which bring in information from K8s and Spark together in one single pane of glass, and also provides a separate window to analyze metrics on Spark Streaming data. As Figure 1 illustrates, our Kubernetes dashboard delivers detailed insights about Spark usage on Pulse and across the entire data landscape.
We encourage you to learn more about Spark management in Pulse; for this blog, we will focus on monitoring Spark on Kubernetes and its various components.
Accessing Spark Metrics
Spark Metrics is a configurable system based on the Dropwizard Metrics Library. Using this library, makes it possible to report Spark metrics to a variety of sinks including HTTP, JMX, and CSV files.
The main two ways to access the metrics are either through the Spark UI or through the REST API. The REST API returns JSON making it easy to create visualizations and utilize monitoring tools which we will turn to next.
Visualizing Spark Metrics
Spark UI
Every instance of SparkContext runs Spark UI. It does this on port 404 and it displays critical data like a list of scheduler stages and tasks, a summary of RDD sizes and memory usage, environmental information, and running executors information. These metrics are only viewable for the life of the application. ```spark.eventLog.enabled```` must be set to true if you want the data to be persisted to storage after the application ends.
To access the Spark UI on Kubernetes, you need to port forward to it by running
$ kubectl port-forward <driver-pod-name> 4040:4040</driver-pod-name>
It can then be opened at http://localhost:4040/.
If you want to access the UI after the application is finished, you need to configure ```spark.eventLog.dir ``` to write the logs to your chosen backend storage. A Spark History server can then be set up with a Helm chart and pointed to your backend to view the Spark UI. You can see the full details here.
Kubernetes Dashboard
The Kubernetes Dashboard is a general-purpose web UI for Kubernetes clusters. Beyond viewing and managing applications, it also allows users to monitor their status. The dashboard provides basic metrics like memory usage, CPU utilization, I/O, and disk space.
While it provides useful information, it can be difficult to link these metrics with the actual Spark jobs and stages. In addition, the metrics are lost after the jobs finish unless they are persisted into another storage backend.
Spark Monitoring and Acceldata Dashboards
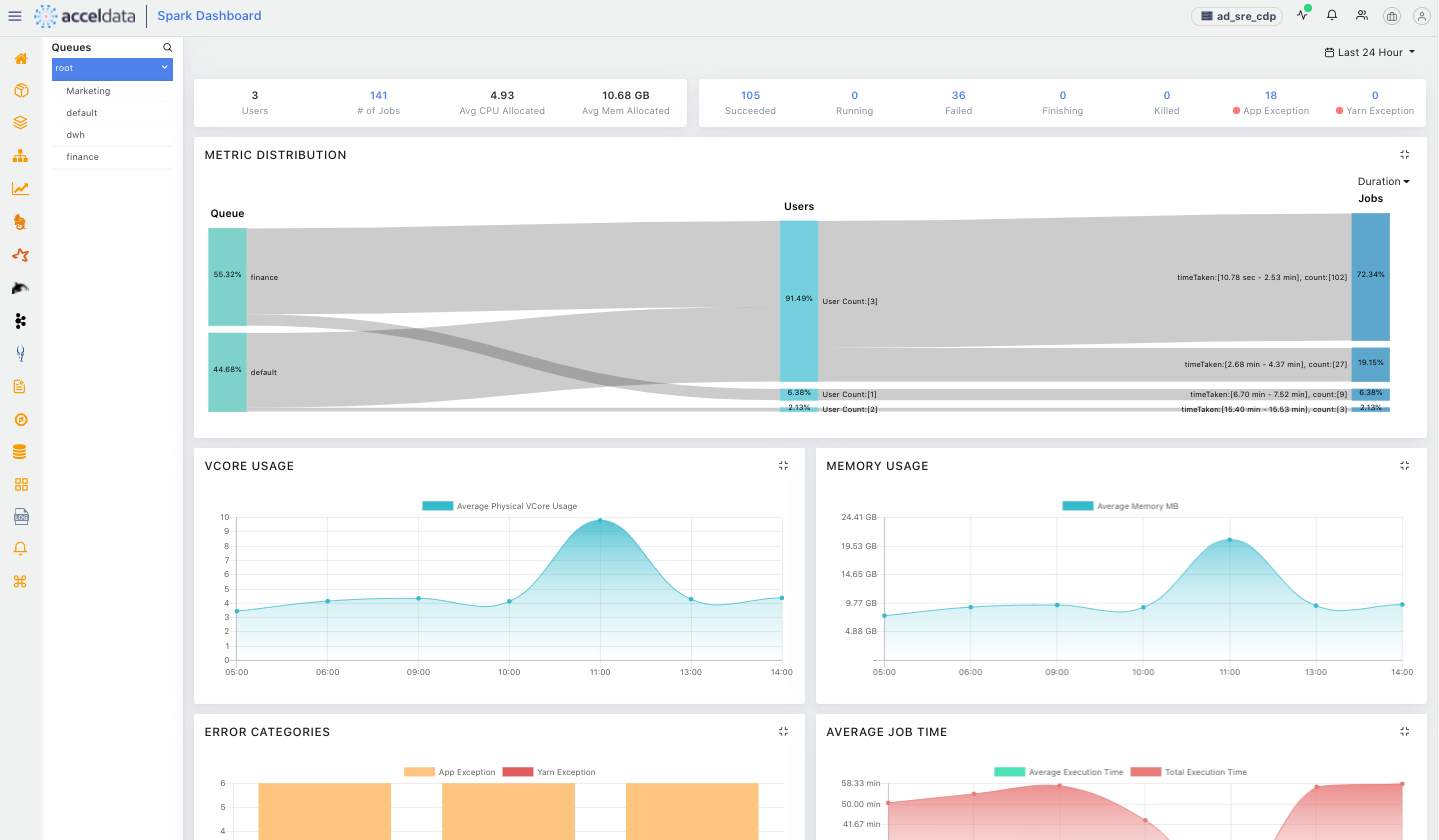
In addition to these dashboards, you can create custom visualizations of your data through Acceldata’s Pulse integration. To view the Spark Dashboard, click Spark --> Dashboard. The dashboard consists of summary panels, a Sankey Diagram with various metrics, and charts that display information about jobs based on other criteria such as memory and core utilization.
The Metric distributions panel displays the summary of jobs as a Sankey diagram (example shown in Figure 2). By default, the chart displays the distribution by Duration. You can choose to display the distribution by VCore, VCore Time, Memory, Memory Time, Used Containers, and GC Time.

We invite you to read our documentation about the Pulse integration with Spark to learn the complete scope of how you can utilize Spark capabilities.
Increase Spark Observability with Acceldata
As companies move more Spark workloads onto Kubernetes, it is imperative they include Spark monitoring to make sure they are getting the top performance from their infrastructure. The Kubernetes Dashboard and Spark UI provide pre-built visualizations while exporting Spark Metrics to Acceldata provides a flexible way to surface this data and take away actionable insights.
Join us for a demo of the Acceldata platform to learn more about our Spark monitoring capabilities.


