


.svg)


Enterprises are increasingly prioritizing data quality and data reliability in their effort to develop data products and services. To support those efforts, they are employing data observability as a way to achieve data quality and reliability at scale. For enterprises that use Databricks, the Acceldata Data Observability platform provides an optimal structure for ensuring data reliability, and a framework for optimizing performance and cost. At its foundation, Acceldata’s integration with Databricks gives users the most comprehensive operational observability into their Apache Spark deployments.
Databricks functions as the de-facto cloud platform for Spark; it allows users to perform cluster management and deploy Spark applications in cloud environments. It is an open-source unified data analytics engine for large scale data processing and can support Spark users with both expressive (Scala and Python) and simple (Spark SQL) ways of working with petabyte-scale data. Ultimately, what makes it so attractive to data teams is its flexible approach to launching and managing Spark clusters on all three major cloud platforms.
Consider the importance of Spark for modern data stacks - as a distributed data technology and cluster configuration solution, it is one of the few truly impactful ways to manage and optimize data job performance. Unless you’re a Spark expert, there is no easy way to find out how to configure your cluster and job to maximize performance. This can lead to poor performance, operational issues, and increased cloud costs. Some of the common problems observed are:
- Lack of cost transparency and governance leading to unexpected spend
- Underutilized, inefficient, or unhealthy clusters and workflows
- Long time to debug workflows
- Unadministered and fragile account configurations, less expertise in newer technologies
- Lack of data layout/partitioning and usage analytics
Data Observability for Databricks Performance Optimization
Acceldata helps enterprise data teams observe their cluster and the performance of their jobs. It enables teams to implement data reliability techniques for Delta Lake on Databricks.
NOTE: The 2.7.0 version release of the Acceldata Data Observability Cloud includes a variety of new Databricks capabilities, including Databricks guardrails, a Databricks Query Studio experience that is similar to Snowflake Query Studio, optimized Databricks navigation, and a host of other features. Please see our release notes for a full list of new Databricks-related and other features.
In this blog, we’ll show you how you can deploy Acceldata to your Databricks cluster and essential benefits, including how to:
- Get 360-degree observability for all flavors and features of the Databricks data platform
- Have a comprehensive, unified view for costs incurred, for both Databricks and for cloud vendor costs
- Reduce MTTR for broken jobs
- Get actionable insights, anomaly detection, alerting, reporting, and guardrail recommendations for robust administration of Databricks accounts

The Acceldata Data Observability platform provides a simple and safe way to register a Databricks data source. The user is asked to provide the Databricks connection details along with the necessary credentials and a choice to opt in for compute and/or data reliability. Post-registration, Acceldata Data Observability will provide visualization for the following categories:
- Spend tracking
- Cluster or compute usage
- Workflow debugging
- Data insights
Spend Tracking for Databricks
Under spend tracking, the Acceldata platform provides visibility across different Databricks dimensions including cluster types, workspaces, node types, and also split-of-cost across databricks and your cloud vendor costs for dataplane. This helps to identify what is driving the cost for the Databricks resource type. These top-level views of the Databricks environment become the starting point for understanding where to focus the deeper optimization efforts.
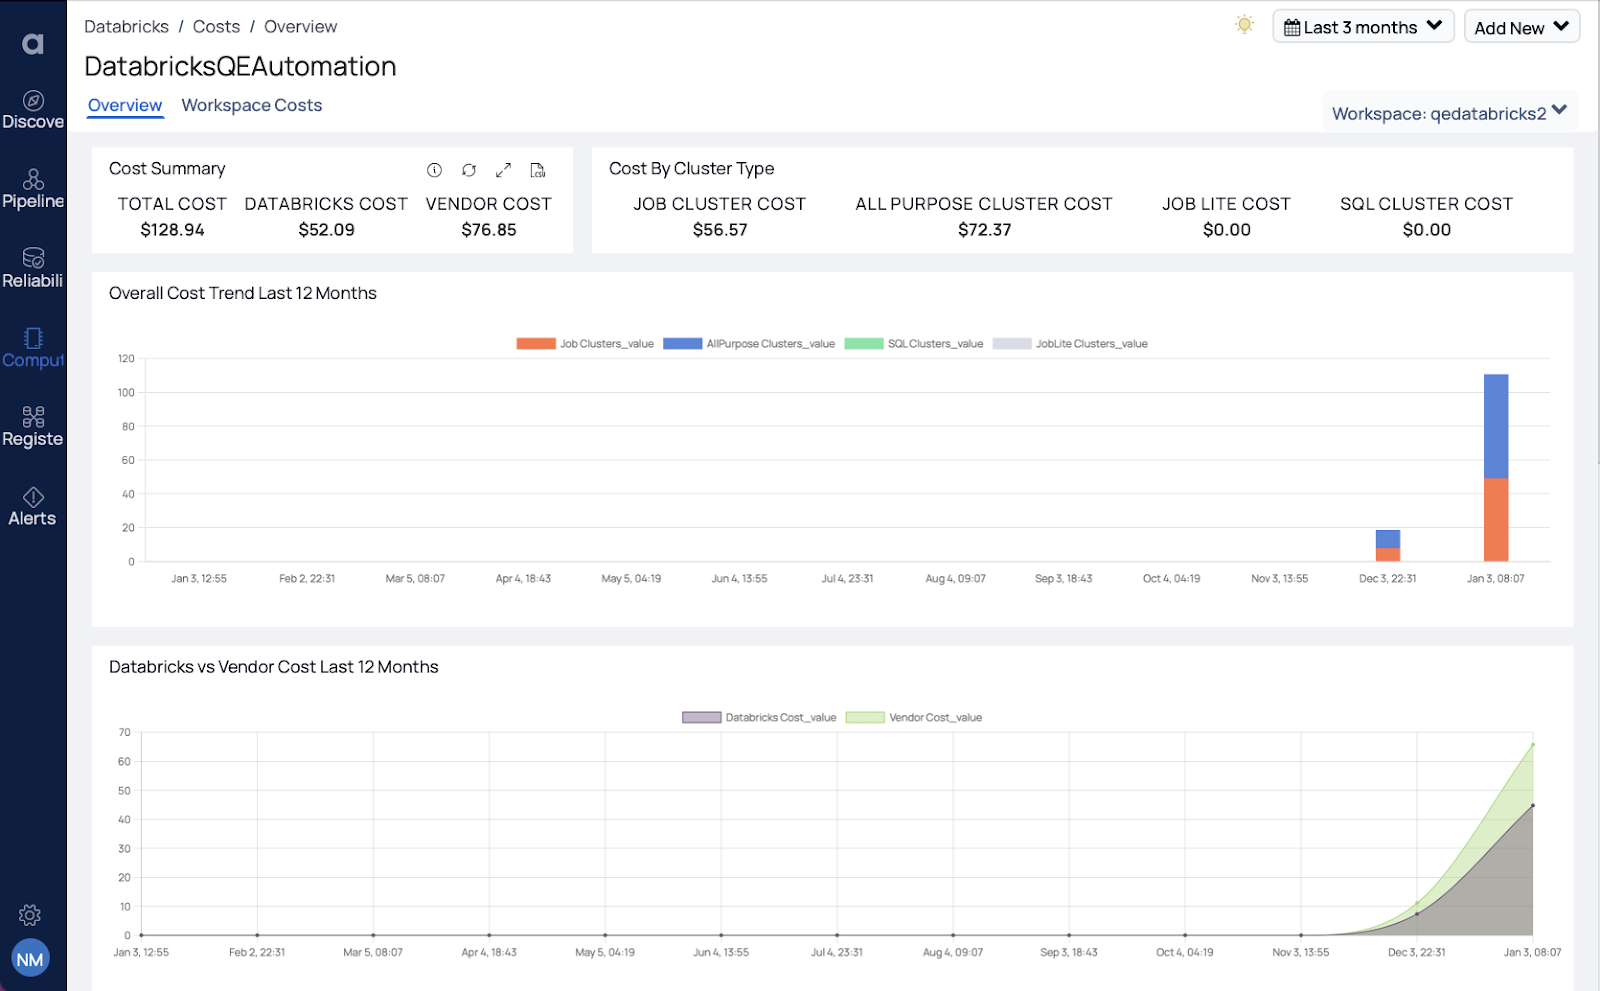
Databricks costs can be assigned to different units of an organization. If Databricks tags are used, those tags can be used to auto assign resources to organization units. Once the organization units are configured, historic costs analysis by organization units is available with cost areas highlighted. This allows an optimization analysis to quickly prioritize organization units for optimization.

Cluster and Compute Usage for Databricks
Under cluster tracking, you can see dashboards that provide a view of the cluster state statistics and failures that can happen due to the complex architecture of control plane/dataplane and the distributed system in general. Acceldata-deployed smart agents are able to collect and correlate the system level metrics to provide the inefficient or wasteful utilization of resources that are happening in the workspace and who those users are. Often, the clusters fail in background for various reasons related to cluster sizing or cloud provider resourcing or permissions issues. All such failures can be notified on and remediate the issues asap.

The rightsizing of clusters is critical from a performance and cost perspective. The cluster usage charts clearly show the wasted cores and memory resources for clusters. One can also get the complete list of clusters observed and slice and dice it over various filters helpful for building a strong understanding of cluster configurations and usage.

Data Insights for Databricks
Acceldata provides equally important information about the Databricks File System (DBFS) in the form of insights about the cost of cloud object storage, total number and size of tables, and the updates happening to these data assets. It is critical to understand the data lake costs associated with storage and API calls made to cloud vendors.

Workflow Debugging for Databricks
Finally the workflow level insights and recommendations - all of the necessary metrics like those for database, CPU, memory, and disk, are displayed in relevant logs that are scrubbed smartly and displayed in a correlated manner at a single location. You can view the historical trend of job executions and also compare the runs side by side. Users can automatically create lineage charts for complex Databricks charts to help you understand, debug the job with simplicity and reduce the MTTR for any issues observed.
Databricks jobs can be complex. With larger data engineering teams contributing code over time it becomes difficult to understand what the job actually does. Acceldata provides a comprehensive graph view that describes exactly what the job was designed to do and all the different steps it takes to perform its tasks. Along with the status of the workload, it’s important to monitor resource metrics at the stage level to understand how the job is processing your data.
A Databricks job is split into tasks which are further broken down into stages that represent a set of similar computing tasks needed to run a job. This is organized by the driver node for parallel execution across worker nodes. Each worker node stores a chunk of your data to process as a partition. When data from different workers are needed, Spark initiates a shuffle operation. Knowing which stages are performing poorly compared to others is key to optimizing performance. The Acceldata platform provides a stage-by-stage breakdown sorted by time taken and detailed metrics related to each stage.
Data Reliability for Databricks
Let’s move to the data reliability part. It’s all about data, garbage in garbage out. Data-driven enterprises that make decisions looking at dashboards or depend on their ML models cannot afford to have bad data. And data can fail in many ways and the data engineers would want to be proactive about these failures and fix the issues as quickly as possible.

Out of the thousands of data assets we have, how do we know which one to look at? So what we do is lay out the data assets with respect to their usage and reliability. Ideally we want all the data to be of high quality but based on the usage and amount of data, one can decide to prioritize or segment the data to run data quality rules on. Data cadence dashboards provide the timeliness views for data assets. Timeliness as a concept refers to:
- Freshness (updates on asset table with time): Whether my asset updates are happening timely, or was there a significant delay observed based on historical data, etc.
- Volume of incoming data: Volume can be monitored either at the row-level/file size depending on the user and the asset type. Acceldata can automatically detect and profile the most used tables in Delta Lake. This configuration can also be changed to manual profiling. Profiling the data helps you understand the data distribution across the columns. Acceldata is built to scale with your data, In this example, A data profile for three million rows was built in 90 seconds. Once your data profile is built, Acceldata will automatically start detecting anomalies in your dataset. You can also apply data quality policies, data reconciliation policies, detect schema drift and data drift, inspect data lineages, and much more.
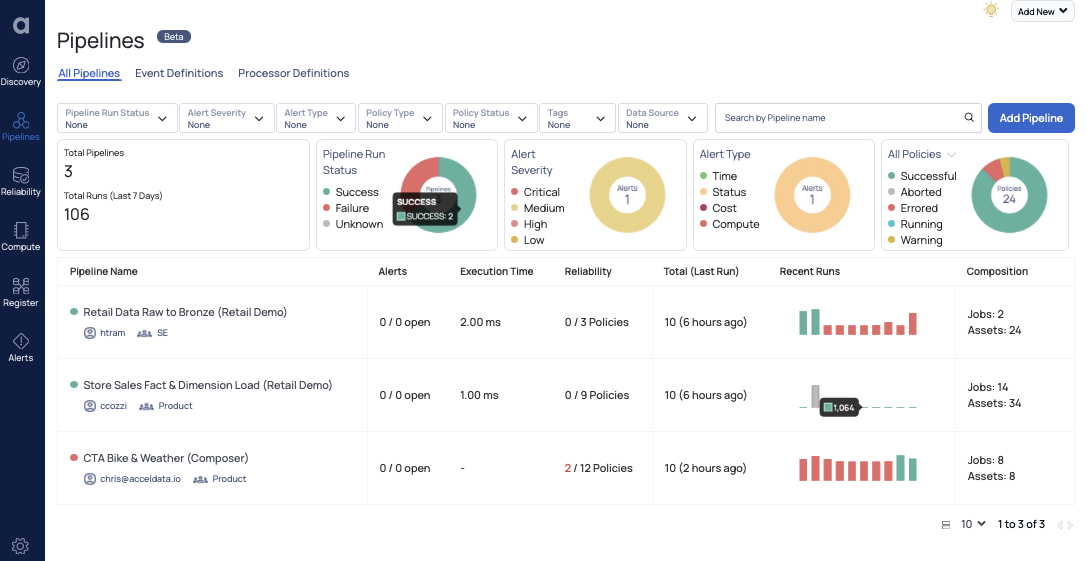
And these data pipelines are the reason for the continuous management performed by data teams. Keeping the pipelines healthy, up and running in a cost efficient manner is the main objective. This view here visualizes the data pipeline - different assets the pipeline touches and the compute operations it performs on it. You can see the heath of data assets and the time the logic took to execute contributing towards the runtime of the pipeline and creating alerts on top of it.
Learn how Acceldata for Databricks is helping data teams maximize the return on their Databricks investment with insight into data reliability, performance, cost, and more.
Photo by David Bruno Silva on Unsplash


